market microstructure · order flow · VPIN · real-time dashboard · open source
Most retail traders watch candlestick charts and RSI. They see price. That's it.
Walk onto any institutional trading desk and you'll see something completely different. Screens filled with order book depth, volume-synchronized probability of informed trading, limit order book imbalance ratios, trade-to-order ratios. They're not watching price. They're watching the mechanics underneath price.
This isn't decorative. VPIN spikes before flash crashes. LOB imbalance predicts short-term price direction. The order-to-trade ratio reveals whether the order book is real or mostly noise. These are the metrics that matter. And retail doesn't have access to them.
Bloomberg terminals cost $24,000 a year. The tools institutional desks use are proprietary. So I built my own.
Here's exactly how I did it, step by step.
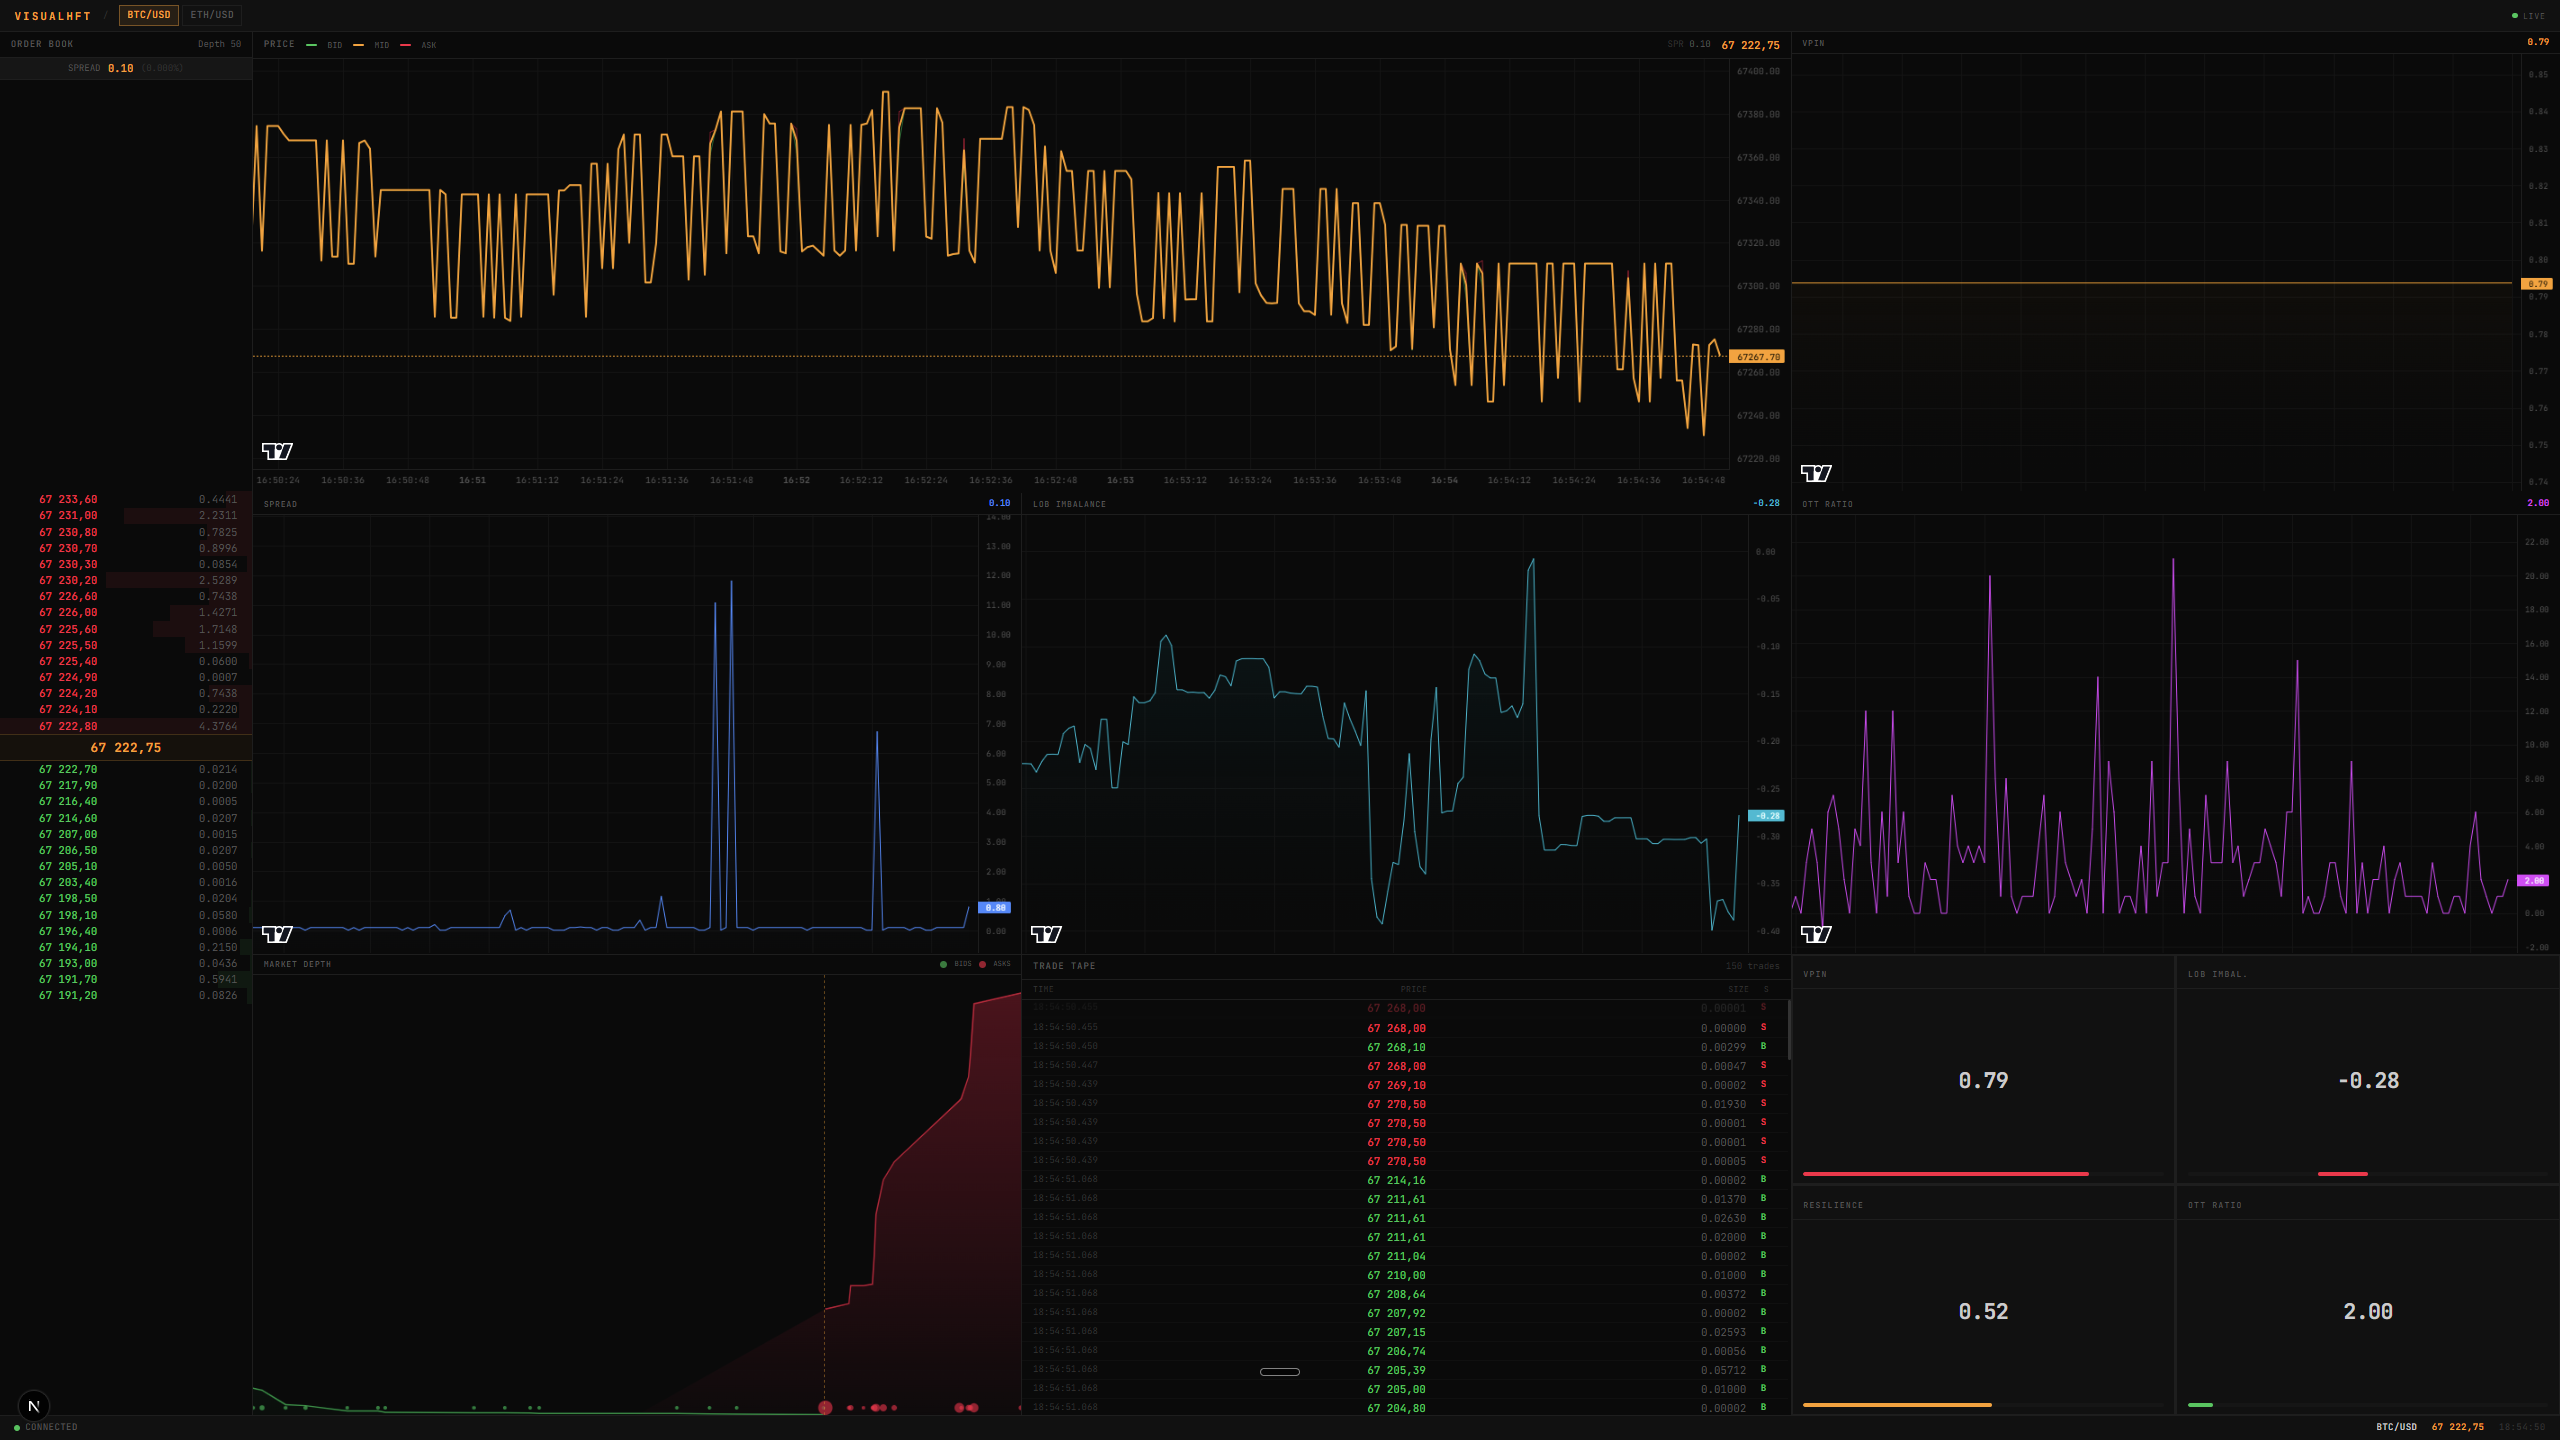
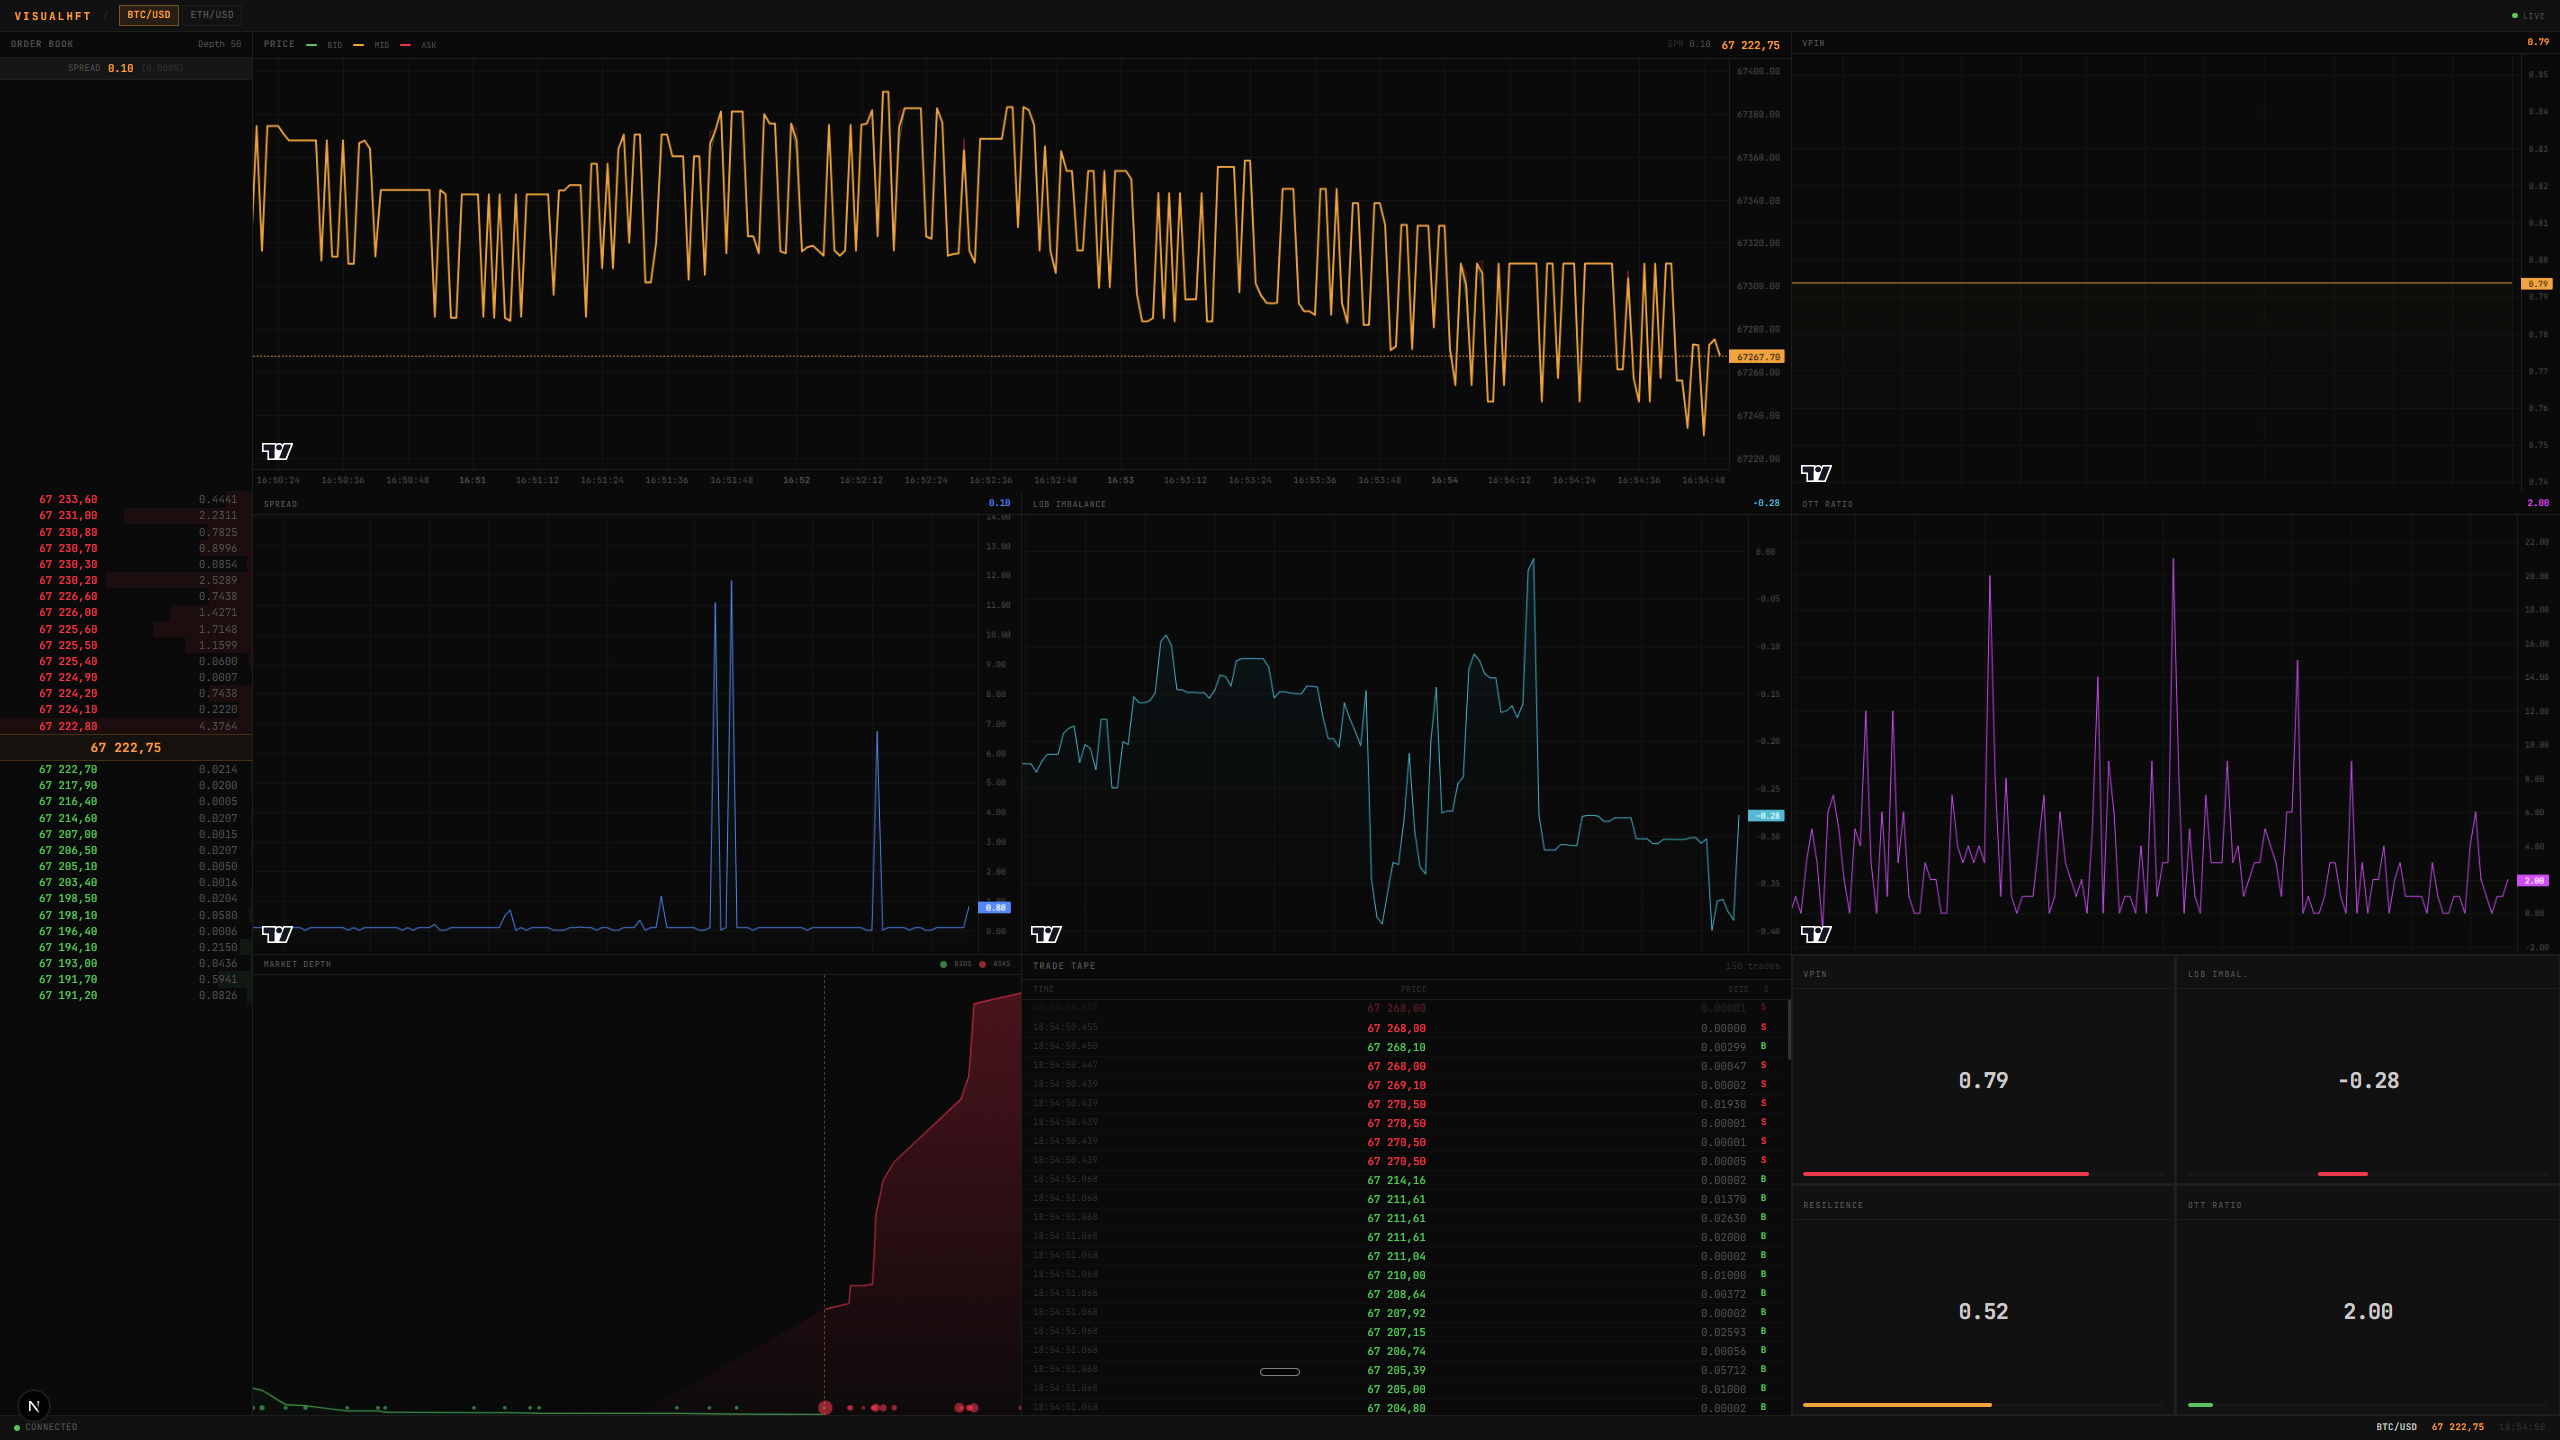
The finished product. Nine panels of real-time microstructure data streaming live from Binance.
Step 1: The C# Engine
I didn't build the analytics engine from scratch. There's an open-source project called VisualHFT, built by silahian (github.com/silahian/VisualHFT), licensed under Apache 2.0. It's a C# .NET 8 application that connects to exchange WebSocket feeds, reconstructs the full limit order book in memory, and runs study plugins that compute microstructure metrics in real-time.
The study plugins it ships with:
VPIN. Volume-Synchronized Probability of Informed Trading.
LOB Imbalance. Limit Order Book bid/ask volume ratio.
Market Resilience. How fast the order book recovers after a trade.
OTT Ratio. Order-to-Trade ratio.
It also has nine exchange connectors built in: Binance, Coinbase, Kraken, KuCoin, Bitfinex, BitStamp, Gemini, and a generic WebSocket connector.
The problem? It's a WPF desktop application. Windows only. The UI is tied to the C# code. No way to customize the frontend, no way to run it headless, no way to pipe the data somewhere else.
So I cloned the repo and started modifying it.
Step 2: Building a WebSocket Bridge
The original application renders everything inside WPF. The C# code computes the metrics and the WPF views display them directly. I needed to decouple these two things. I wanted the C# engine to do what it's good at (connecting to exchanges, building order books, running studies) and then broadcast the results over WebSocket so any frontend can consume them.
I created a new project inside the solution called VisualHFT.WebServer. It's an ASP.NET Core console application that runs on port 5000. No WPF. No UI. Just a headless server.
The tricky part was plugin loading. The original app loads study plugins and exchange connectors dynamically at runtime using reflection. It scans a directory for DLLs, finds classes that implement IPlugin, and instantiates them. This is deeply tied to the WPF app's startup sequence. I had to replicate this entire plugin loading system in my headless server without any of the WPF dependencies.
I wrote a HeadlessPluginLoader that does the same reflection-based scanning, instantiates the plugins, and starts them. Then I wrote three bridge classes:
MarketDataBridge. Subscribes to the C# engine's internal order book and trade event bus, converts the data into JSON-serializable DTOs, and pushes them into a broadcast channel. Order book updates are throttled to 10 per second to avoid drowning the WebSocket connection.
StudyBridge. Hooks into the OnCalculated event on every loaded study plugin. When VPIN computes a new value, when LOB Imbalance updates, when Market Resilience changes, each of these fires an event. The bridge catches it, wraps it in a DTO, and broadcasts it.
WebSocketBroadcaster. Manages all connected WebSocket clients. When a bridge pushes data, the broadcaster serializes it to JSON and sends it to every connected client simultaneously.
The message format is simple. Every message has a type field (orderbook, trade, study, or provider) and the corresponding data. The frontend just switches on the type and routes to the right handler.
Step 3: Configuring the Studies
This one took me a while to figure out. I had the WebSocket server running, order book data was flowing, trades were streaming. But the study metrics were completely silent. VPIN showed nothing. LOB Imbalance showed nothing. Everything was flat at zero.
The problem turned out to be inside the study plugins themselves. Each study has an internal filter: it checks the incoming data's symbol and provider ID against its own settings. If they don't match, the study silently drops the data. By default, every study plugin initializes with Symbol = "" and ProviderID = 0. Since the Binance connector sends data tagged as BTC/USD with provider ID 1, nothing matched. Every single data point was being thrown away.
The fix was adding a ConfigureStudies method to the plugin loader. Before starting any plugins, I iterate through all loaded studies and set their symbol and provider settings to match the actual data source. Once that was in place, all four study plugins started producing values immediately.
This kind of thing doesn't show up in any documentation. The original WPF app handles it through the UI settings panel. In headless mode, you have to do it manually or everything looks like it's broken when it's actually just misconfigured.
Step 4: The Frontend
With the C# backend broadcasting everything over WebSocket, I needed a frontend to display it. I created a new folder in the project root called visualhft-ui and scaffolded a Next.js application with TypeScript and TailwindCSS.
The aesthetic I was going for was Bloomberg Terminal. Black background, monospace font, amber and green accents, dense information. No whitespace, no rounded corners, no friendly colors. Every pixel shows data.
The frontend architecture is straightforward:
WebSocket client. A class that connects to ws://localhost:5000/ws, automatically reconnects with exponential backoff if the connection drops, and dispatches incoming messages by type to registered handlers.
Central state hook. A single React hook called useMarketData that uses useReducer to manage all market state. Every WebSocket message updates this reducer. Order book data, trade history, study values, price history, spread history. Everything lives in one state object. Components just read from it.
Nine visualization components:
Order Book: bid/ask ladder with size bars, rendered as a styled table
Price Chart: three line series (bid, mid, ask) using TradingView's lightweight-charts library
Spread Chart: area chart tracking bid-ask spread over time
VPIN Chart: time series of VPIN values
LOB Imbalance Chart: time series of LOB Imbalance values
OTT Ratio Chart: time series of Order-to-Trade Ratio values
Market Depth: cumulative depth visualization rendered on HTML Canvas
Trade Tape: scrolling list of executed trades, color-coded buy/sell
Metrics Panel: four cards showing current values of each study
The layout. Order book takes the full left column. The right side is a 3x3 grid of charts and metric panels.
Step 5: Handling Multi-Symbol Data
The Binance connector streams data for multiple symbols simultaneously. BTC/USD and ETH/USD by default. Without filtering, the order book panel would flicker between the two symbols on every update, overwriting one with the other ten times per second.
I added a symbol filter to the state hook. The frontend tracks which symbol is currently selected and only processes messages that match. Symbols are auto-discovered from the incoming data stream. The first time the frontend sees a new symbol in an order book message, it adds it to the available symbols list. Buttons appear in the top bar. Click one, and the state clears and starts accumulating data for the new symbol.
Symbols auto-discovered from the data stream. Click to switch.
Step 6: Performance Tuning
Real-time data at 10 updates per second creates problems if you're not careful.
The price chart was the worst offender. Every order book update pushed a new data point, which meant the chart was receiving 10 points per second. Since multiple updates often land in the same second, the chart would overwrite the same timestamp repeatedly, causing visible flickering. I added a one-point-per-second throttle. If a data point has the same timestamp as the previous one, it's skipped.
The order book on the backend side needed throttling too. The Binance WebSocket fires a callback on the connector thread every time the order book changes, and this callback must not block. The bridge copies the data into a DTO and pushes it into a Channel<T>. A background consumer reads from the channel and applies a 100ms per-symbol throttle before broadcasting. This keeps the update rate at 10Hz maximum without blocking the connector.
For the React components, every panel is wrapped in React.memo to prevent unnecessary re-renders. The depth chart uses raw Canvas rendering instead of a charting library because it needs to redraw the entire visualization on every update. No charting library handles that efficiently.
History arrays are capped at 600 points, roughly 10 minutes of data. Each new point is deduplicated by timestamp to prevent the same second from appearing twice. When the array exceeds the cap, the oldest points are sliced off.
What Each Panel Actually Tells You
Let me break down why each piece of this dashboard matters, because this isn't just a pretty screen.
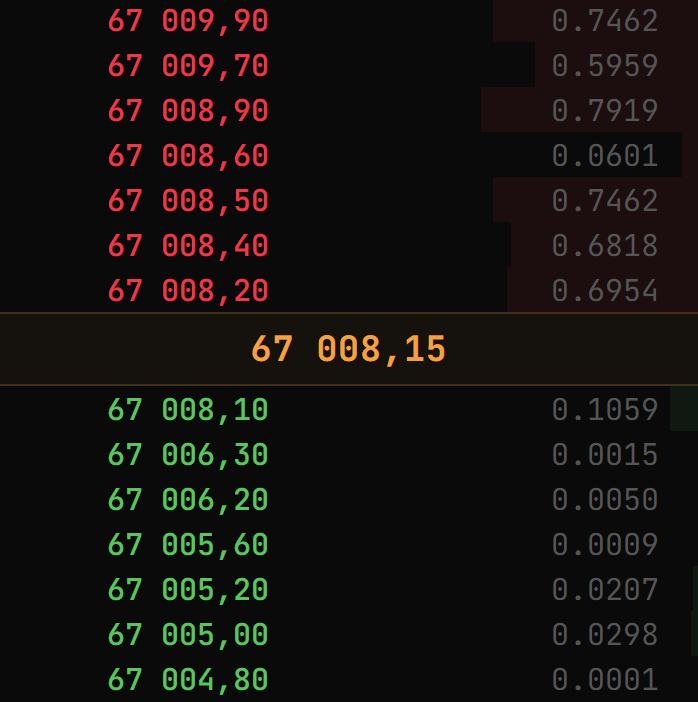
15 levels of depth on each side. Size bars show relative volume.
The Order Book shows you the raw supply and demand at each price level. When you see a massive size bar on the bid side, that's a buyer stacking orders. It could be genuine support, or it could be spoofing. Someone placing large orders they intend to cancel before execution. Either way, it moves behavior. Other participants see that wall and adjust.
VPIN ranges from 0 to 1. It measures whether current volume is driven by informed traders or noise. When VPIN crosses above 0.7, something is happening. During the 2010 Flash Crash, VPIN hit 0.9 two hours before the crash. It's not a crystal ball, but it's one of the best early warning systems that exists.
LOB Imbalance ranges from -1 to 1. Positive means more bid volume than ask volume. Buyers dominating. Negative means sellers dominating. Values beyond ±0.3 have predictive power for short-term price direction. HFT firms use this as a core feature in their models.
The Spread is a liquidity barometer. When it widens, market makers are pulling back. They're less confident. This often precedes sharp moves. When it's tight, the market is healthy and liquid.
Market Resilience measures how quickly the order book recovers after a trade eats into it. A value near 1.0 means high resilience. The book snaps back instantly. When it drops, even small trades start moving price.
OTT Ratio tells you how much of the order book activity is real. A high ratio means lots of orders placed but few executed. That's noise. Possible spoofing, quote stuffing, or just indecisive participants.
These are the metrics that institutional desks monitor every single day. Not moving averages. Not RSI. The actual mechanics of how orders interact with each other in real-time.
The Full Stack
To recap what this project actually required:
C# Backend:
Clone the VisualHFT open-source project
Create a new ASP.NET Core console project inside the solution
Replicate the WPF app's plugin loading system using reflection
Build a WebSocket broadcaster for managing client connections
Write bridge classes that subscribe to the internal event bus and convert data to JSON DTOs
Configure study plugins with the correct symbol and provider settings
Handle order book throttling with System.Threading.Channels
Next.js Frontend:
Scaffold a Next.js + TypeScript + TailwindCSS project
Build a WebSocket client with auto-reconnect and exponential backoff
Create a centralized state management hook with useReducer
Build nine separate visualization components
Implement TradingView lightweight-charts for time series
Implement Canvas rendering for the depth chart
Add symbol auto-discovery and switching
Performance-tune everything for 10Hz update rates
It's two servers running simultaneously. The C# backend connects to Binance, computes everything, and broadcasts on port 5000. The Next.js frontend connects to that WebSocket and renders on port 3000. Open a browser and it's live.
No API keys. No environment variables. No accounts. No cloud. Everything runs locally on your machine.
Full credit to silahian for building the original VisualHFT engine and the study plugins. The C# backend, plugin architecture, and microstructure computations are their work. I built the WebSocket bridge and the web dashboard on top of it.
Get the Tool
If you want to skip the setup and just run the finished dashboard, you can download the complete project (C# backend + Next.js frontend, pre-configured) with a free QuantFrame trial below.
If you'd rather build it yourself or just want the original C# engine without the web dashboard, check out silahian's original project at github.com/silahian/VisualHFT. It's fully open source under Apache 2.0 and works as a standalone Windows desktop app.
Setup
You need two things installed on your machine:
.NET 8 SDK (download from dotnet.microsoft.com)
Node.js 18+ (download from nodejs.org)
That's it. No API keys, no accounts, no environment variables, no config files.
Step 1: Clone the Repository
bash
git clone https://github.com/mirkovicdev/VISUALHFT-DASHBOARD.git
cd VISUALHFT-DASHBOARD
Step 2: Build and Run the C# Backend
Open a terminal in the project root:
bash
dotnet build VisualHFT.sln
dotnet run --project VisualHFT.WebServer
You should see output like this:
markdown
[OK] License: COMMUNITY
[OK] Loaded 10 plugins (5 connectors, 5 studies)
[OK] Configured studies for BTC/USD / Binance
[OK] Web server running on http://0.0.0.0:5000
[..] Starting plugins (timeout: 60s)...
[OK] All plugins started
[OK] MarketDataBridge wired — broadcasting order books + trades
[OK] StudyBridge wired — broadcasting 4 study plugins
The backend is now connected to Binance and streaming live BTC/USD and ETH/USD data. Keep this terminal open.
Step 3: Start the Frontend
Open a second terminal:
bash
cd visualhft-ui
npm install
npm run dev
Open your browser to http://localhost:3000. Live data starts flowing immediately. You'll see the order book updating, trades streaming in, price charts drawing, and study metrics computing in real-time.
The symbol selector in the top bar lets you switch between BTC/USD and ETH/USD. Both are streamed by default from the Binance connector.
Everything runs locally on your machine. No data leaves your network.
End of entry
Found this useful?
Likes decide what gets written next.Sign in to like
QuantFrame
Liked this article?
QuantFrame teaches you the math, code, and projects to break into quant. Plus a personalized roadmap built for your background and goals.