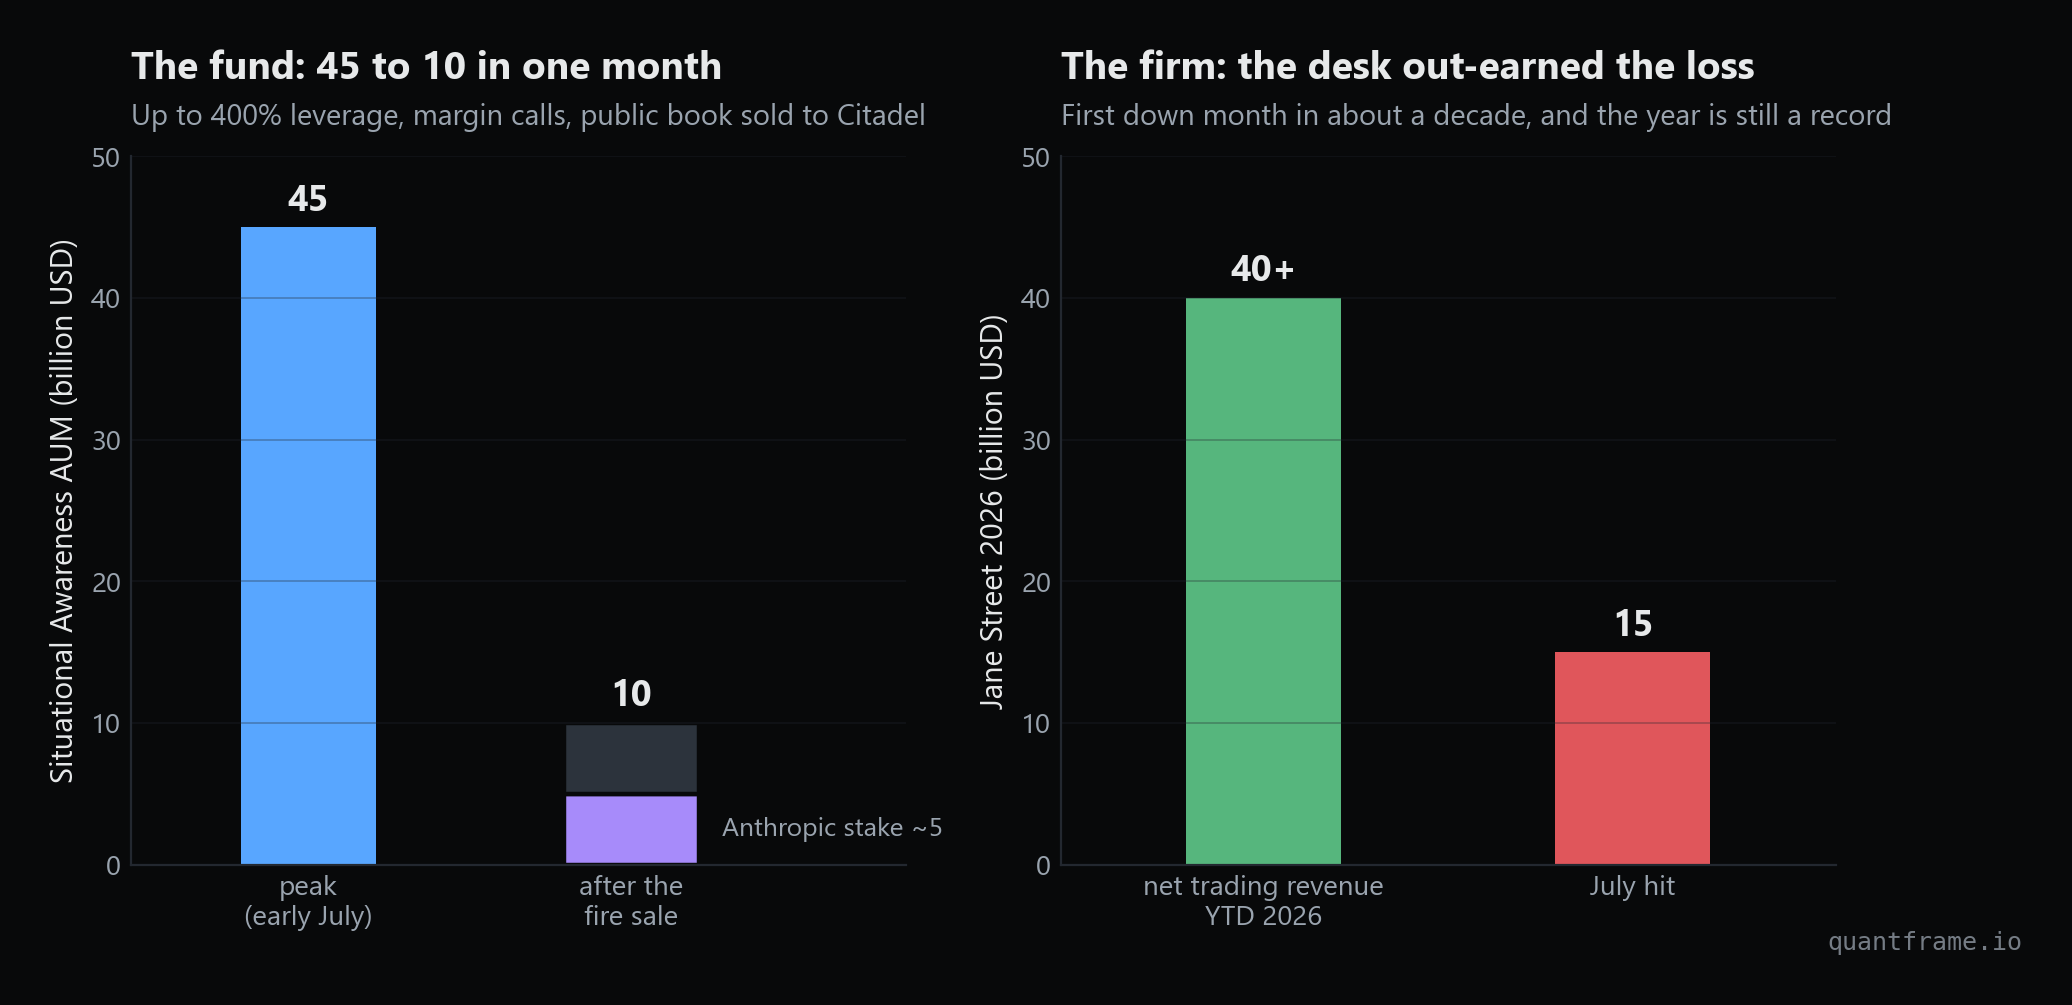
In July 2026, Jane Street lost about 15 billion USD. It was the firm's first down month in roughly a decade, and it happened in a year where its net trading revenue has already passed 40 billion USD, more than its record 39.6 billion for all of 2025.
Sit with that combination for a second. A firm that had not printed a single red month since the mid-2010s dropped fifteen billion in one, and the trading machine that produced the streak was fine the whole time. The loss came from somewhere else.
To see where, you need to know how the machine actually works. Not the cartoon version where market makers "buy low and sell high really fast", but the institutional version: the adverse-selection math that prices the spread, the inventory control that keeps the book on a leash, and the physical infrastructure that defends the quotes. That is this article. The July story comes at the end, because once you understand the machine, you will see exactly why it was not the machine that broke.
A Market Maker Sells Immediacy, Not Opinions
A market maker quotes two prices at once: a bid where it will buy and an ask where it will sell. Anyone who wants to trade right now pays the spread between them. That is the entire product. The desk is not predicting where the price goes; it is selling immediacy, the ability to transact this second instead of waiting for a natural counterparty to show up.
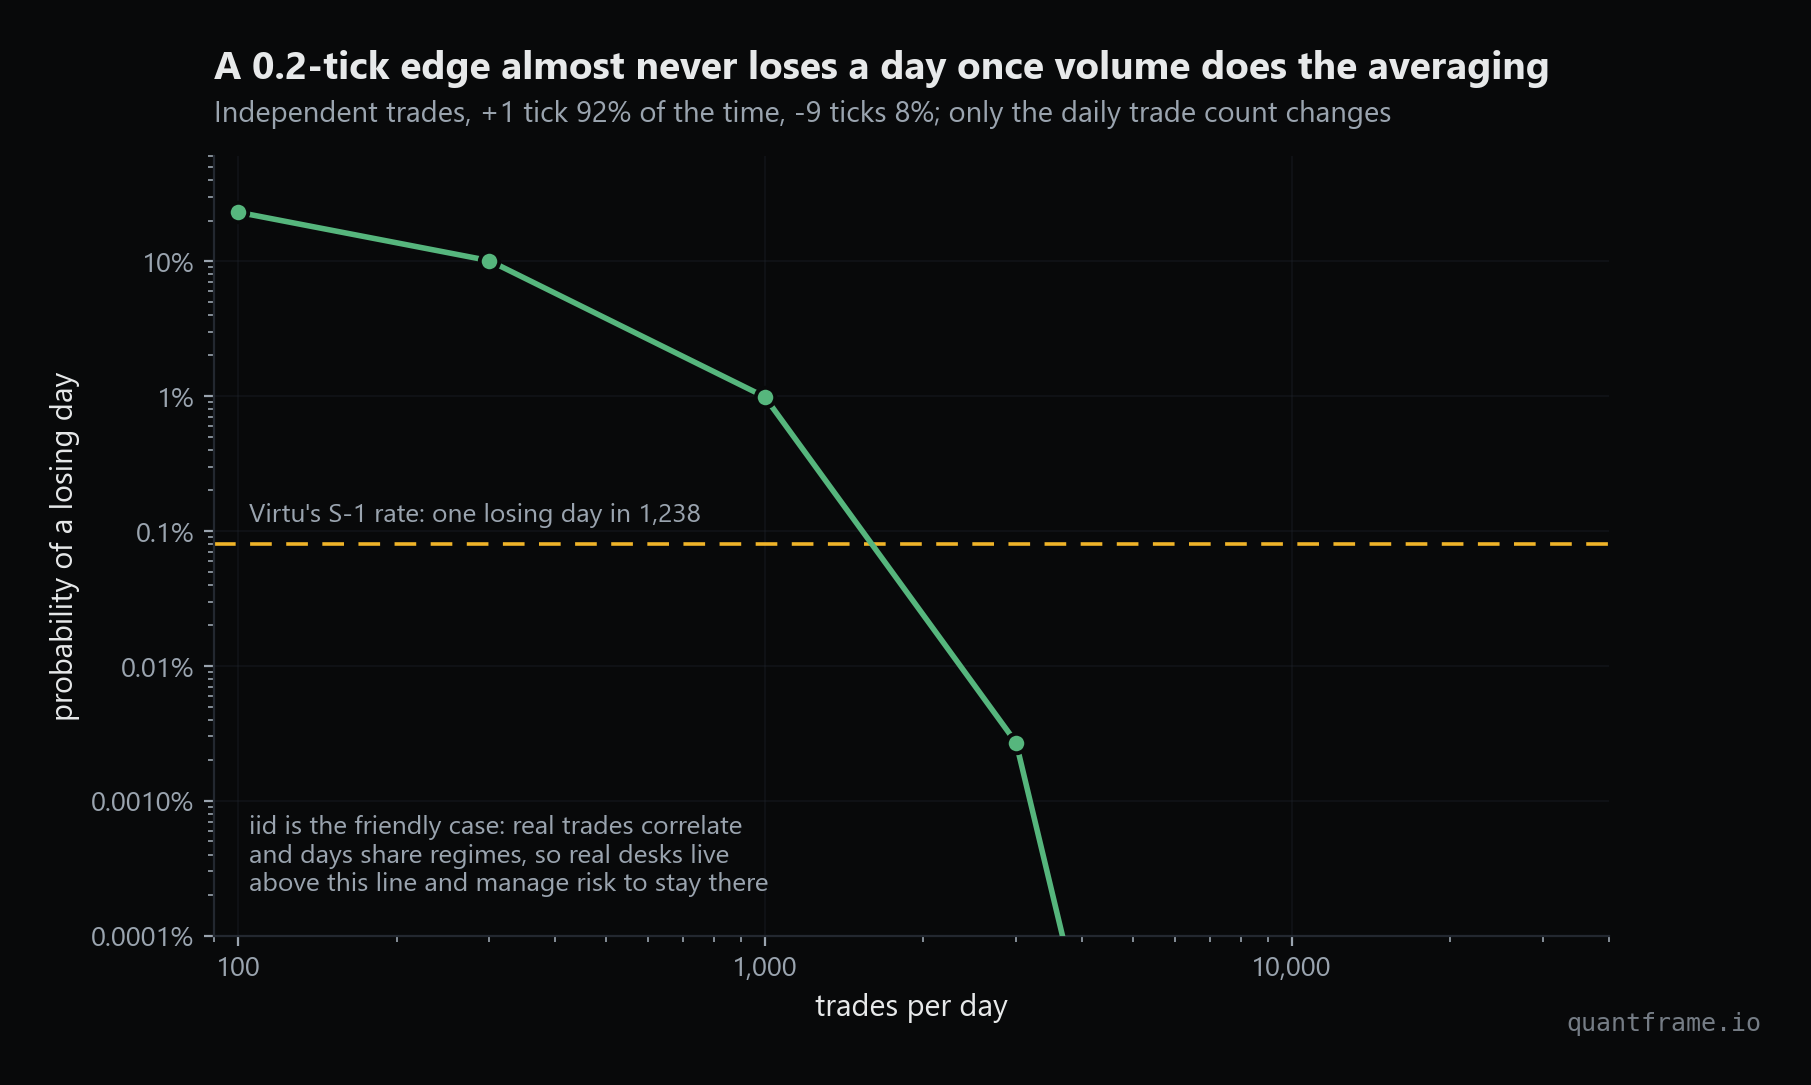
Done well, this produces the most consistent P&L in finance. When Virtu filed to go public, its prospectus disclosed one losing trading day out of 1,238 between January 2009 and December 2013. One. Through the euro crisis, the flash crash, and everything in between.
There is no clairvoyance in that number. There is arithmetic. A market maker's per-trade edge is tiny and its per-trade risk is real, but the trades are many. In my toy model below, each trade wins one tick 92% of the time and loses nine ticks 8% of the time, an expected edge of 0.2 ticks per trade. At 100 trades a day, roughly one day in four still ends red. At 1,000 trades, about one day in a hundred. Past a few thousand independent trades, a losing day becomes numerically invisible.
The averaging is the strategy. The caveat in the corner is why risk desks still exist.
Real desks do not get the independent-trades assumption, which is why the honest version of this chart matters: positions correlate, bad days cluster, and Virtu's actual rate sits well above the idealized line at its volume. The gap between the friendly curve and reality is precisely the part of the job the rest of this article covers.
The Spread Is an Insurance Premium Against Smarter Counterparties
Why does the spread exist at all? Competition should crush it to zero, and against harmless flow it would. It does not, because some of the people hitting your quotes know something you do not. This is adverse selection, and it was formalized by Glosten and Milgrom in 1985: even a risk-neutral market maker with zero costs must quote a positive spread, purely because some counterparties are informed.
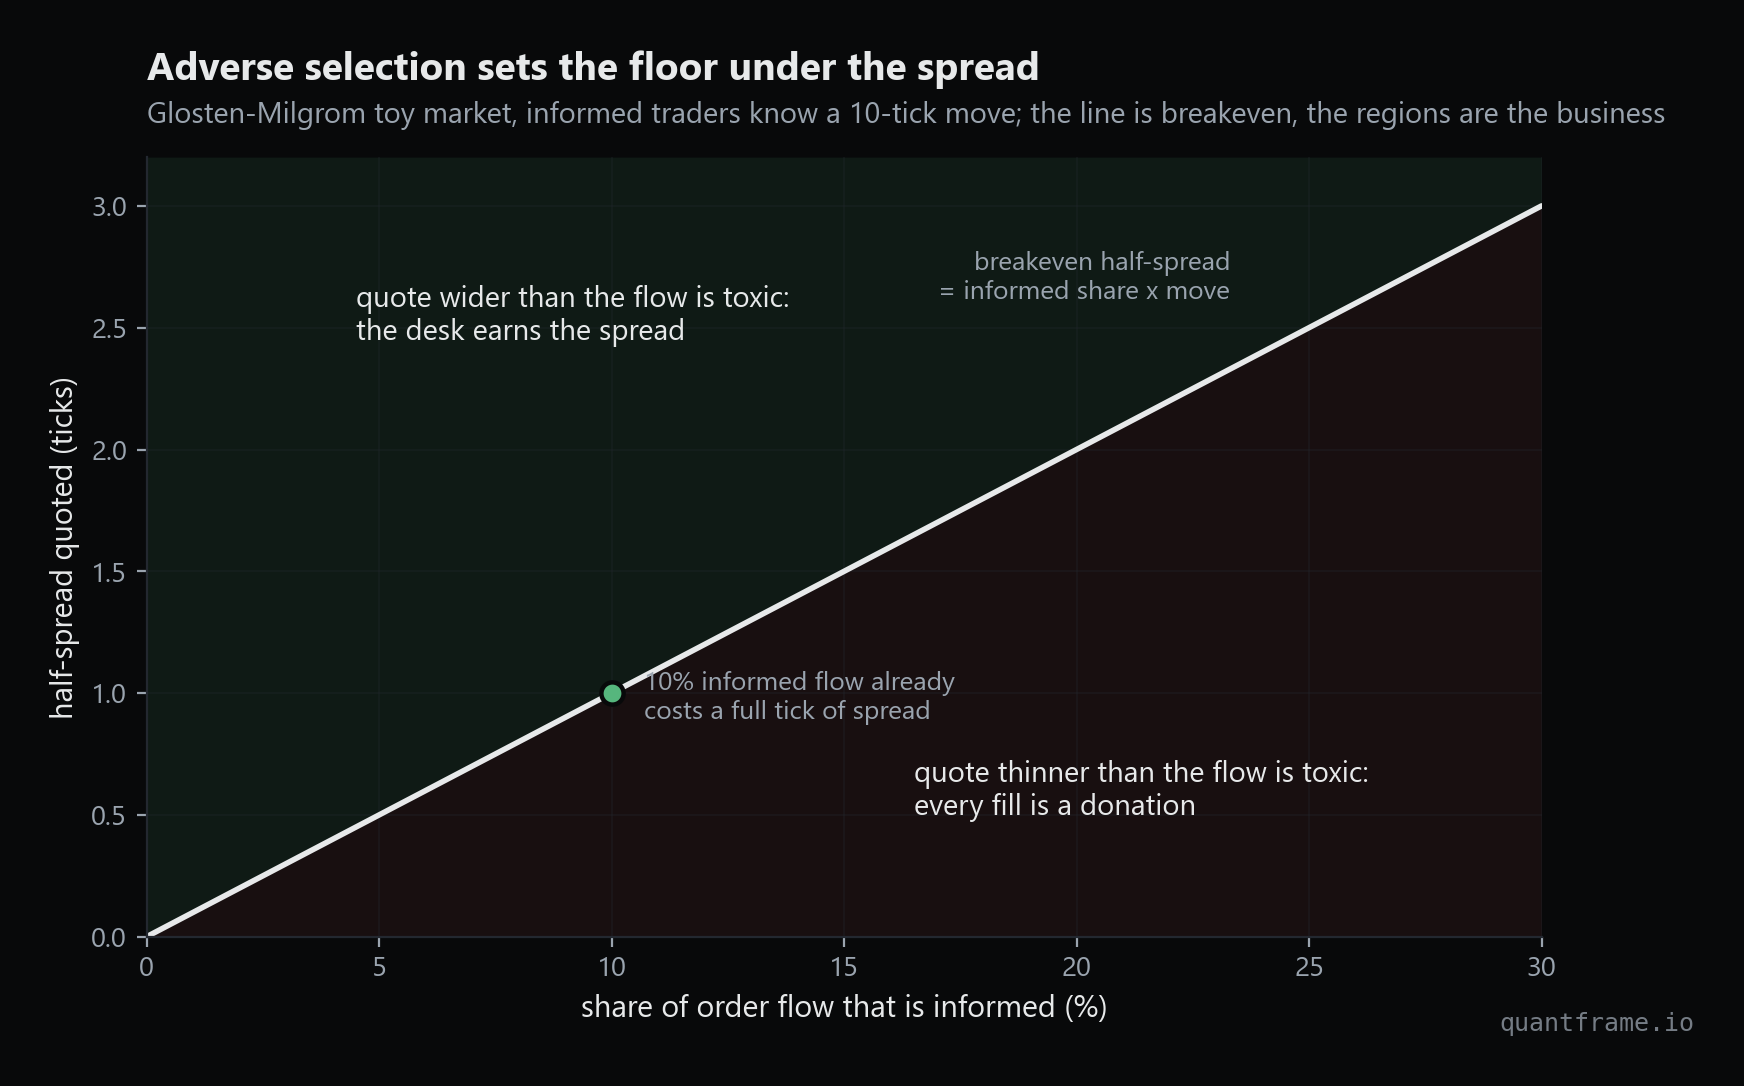
The logic fits in one line. Suppose a fraction π of incoming orders comes from traders who know an imminent move of size J, and the rest is uninformed flow that pays your half-spread h in either direction. Informed traders only trade when they win, so your expectation per trade is
E[P&L per trade]=(1−π)h+π(h−J)=h−πJ
The breakeven half-spread is h∗=πJ. If 10% of your flow is informed about a ten-tick move, you must quote a full tick of half-spread just to survive. Quote tighter and every fill is, on average, a donation to someone better informed than you.
The whole business lives in the wedge between the spread you can quote and the toxicity of the flow you attract.
This is the first thing that separates institutional market making from the retail imagination. The spread is not free money for showing up; it is an insurance premium, priced against the toxicity of the flow. Desks measure this constantly: quoted spread is what you post, realized spread is what you keep after the price moves against your fills. The difference is the adverse-selection bill.
Inventory Is the Position You Never Wanted
The second enemy is subtler. Every fill leaves you holding something. Get hit on the bid repeatedly and you are long a position you never chose, exposed to every tick of market risk while you try to get flat. Unmanaged, your inventory follows a random walk and its variance grows without bound.
The canonical treatment is Avellaneda and Stoikov, 2008. Their market maker does not center quotes on the mid price. It centers them on a reservation price that leans away from its inventory q:
r(s,q,t)=s−qγσ2(T−t)
where s is the mid, γ is risk aversion, σ is volatility, and T−t is the time left in the session. Long inventory pushes the reservation price down, which makes your ask more attractive and your bid less so; the book sells itself back toward flat. Around that center, the optimal total spread is
δa+δb=γσ2(T−t)+γ2ln(1+kγ)
with k describing how quickly fill probability decays as you quote further from the mid, via the arrival intensity λ(δ)=Ae−kδ. The whole quoting engine is a dozen lines:
avellaneda_stoikov_step.pypython
# Avellaneda-Stoikov quoting step (paper parameters:
# gamma=0.1, sigma=2, k=1.5, A=140, dt=0.005)
res = s - q * gamma * sigma**2 * (T - t)          # lean away from inventory
half = (gamma * sigma**2 * (T - t)
        + (2 / gamma) * np.log(1 + gamma / k)) / 2
ask, bid = res + half, res - half

p_fill_ask = A * np.exp(-k * (ask - s)) * dt       # further from mid,
p_fill_bid = A * np.exp(-k * (s - bid)) * dt       # fewer fills

if rng.random() < p_fill_ask:                      # lifted: sell one
    cash += ask; q -= 1
if rng.random() < p_fill_bid:                      # hit: buy one
    cash -= bid; q += 1
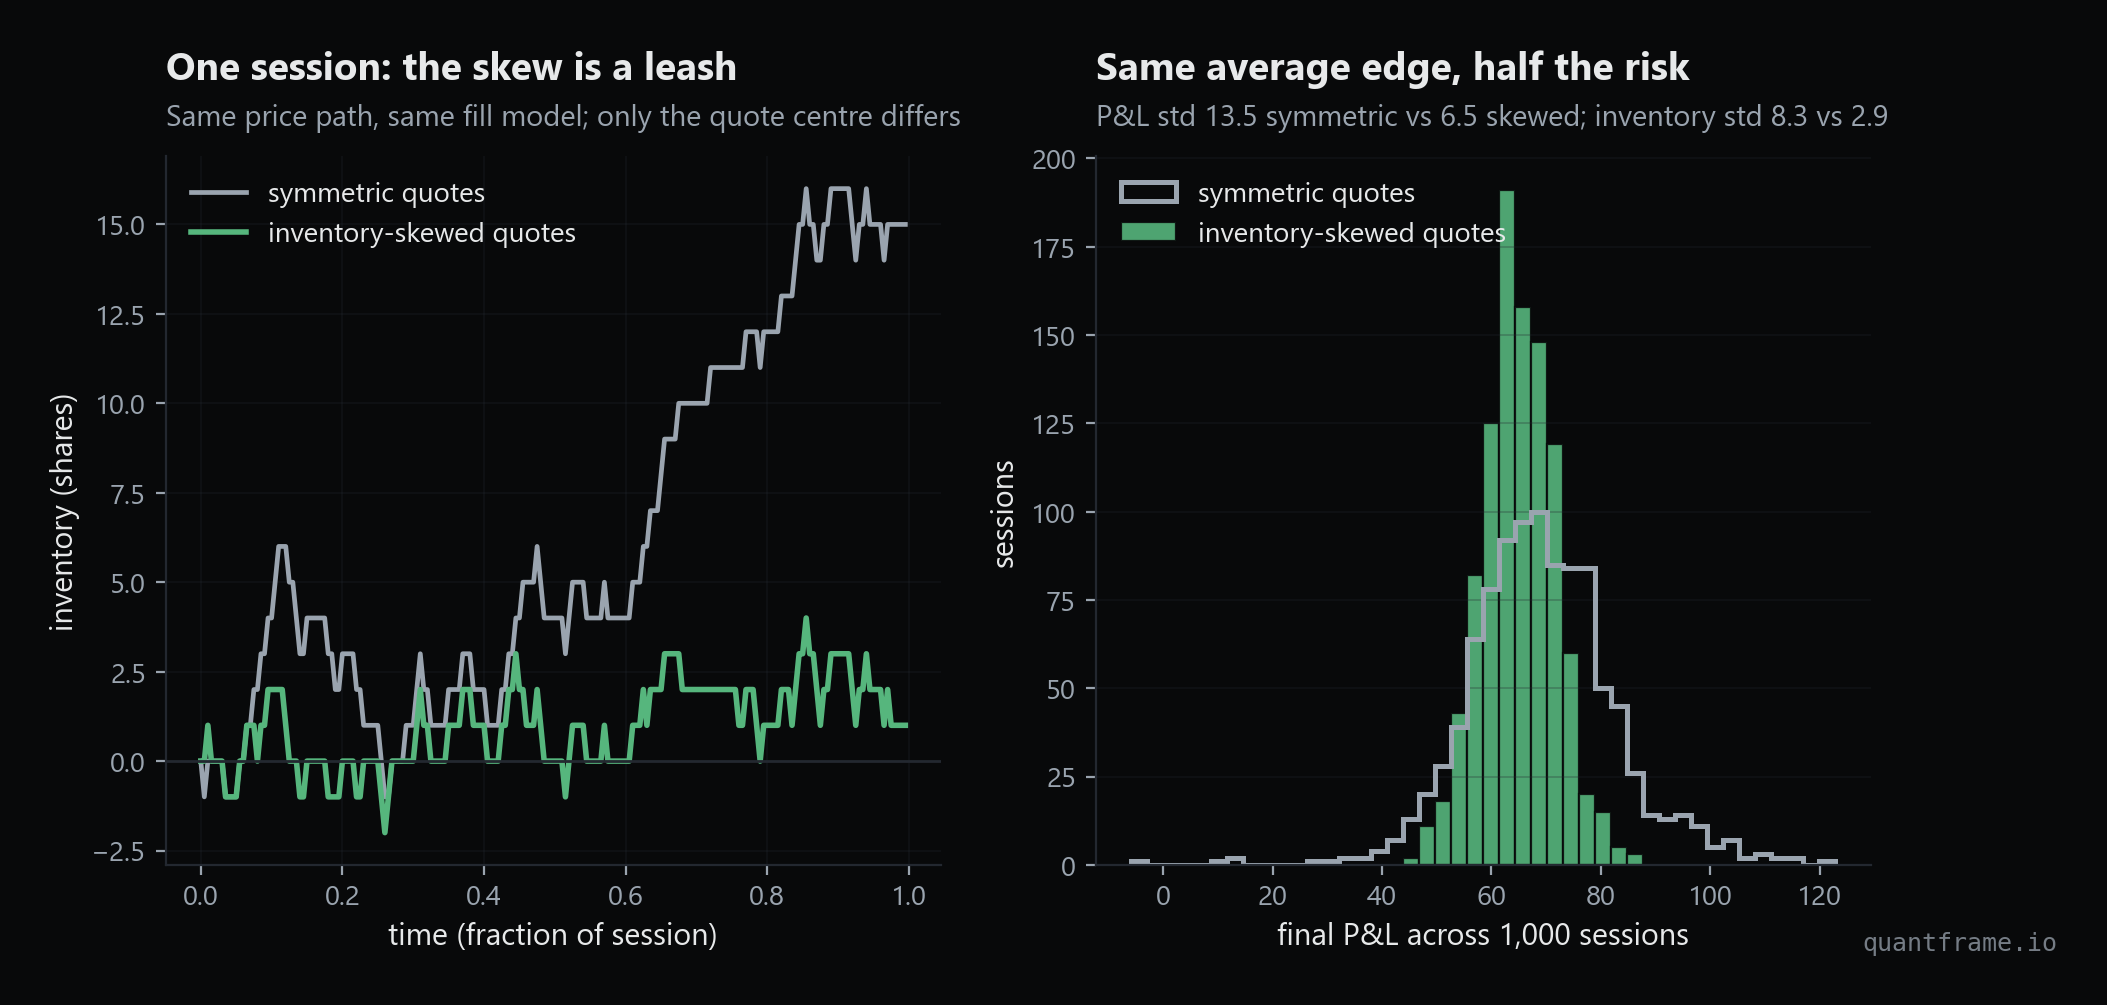
I ran the paper's own experiment: 1,000 simulated sessions with their exact parameters, the skewed strategy against a benchmark that quotes the same average spread symmetrically around the mid. Same price paths, same fill model. The symmetric quoter lets inventory wander (the sample session below drifts 15 shares long) and posts a final-inventory standard deviation of 8.3 with a P&L standard deviation of 13.5. The skewed quoter holds those to 2.9 and 6.5: the P&L risk cut in half for almost the same mean.
The paper's own experiment, rerun. You give up a little average P&L and buy back half your risk.
That trade, a sliver of expected profit exchanged for a massive variance reduction, is the entire personality of the business. It is also why the Virtu number from earlier is possible at all.
Speed Is Defense, and the Physics Bill Is Real
Here is where the mathematics meets the machine room. A market maker's quote is a standing option that anyone may exercise. When news moves the market, every resting quote is momentarily wrong, and whoever reacts first gets to trade against the stale ones. Being slow does not mean earning less; it means becoming the informed flow's favorite counterparty. Speed is not greed, it is defense against adverse selection at machine timescales.
The empirical record here is beautiful. Budish, Cramton, and Shim studied the S&P 500 futures-versus-ETF pair and found that the median duration of a mechanical arbitrage opportunity fell from 97 milliseconds in 2005 to 7 milliseconds in 2011, while the profit per opportunity stayed roughly constant at 0.08 index points. Correlations that look perfect on a daily chart simply break down at millisecond horizons, and the race to harvest those breakdowns never ends, it only gets faster. A follow-up study on UK data found latency races happening about once a minute per FTSE 100 stock, with the typical race decided in 5 to 10 microseconds, and races accounting for roughly 20% of trading volume.
That race is why the infrastructure looks the way it does:
Colocation. Exchanges rent rack space meters from the matching engine: NYSE's data center in Mahwah, Nasdaq's in Carteret, CME's in Aurora. Fairness at that range is so contested that NYSE cuts every colocated customer's fiber to the same length and verifies it with optical backscatter reflectometry. When centimeters of glass are worth auditing, you know what nanoseconds are worth.
The geodesic. Chicago futures and New Jersey equities are two legs of one trade, half a continent apart. The famous Spread Networks fiber, drilled as straight as money allowed, brought the round trip to about 13 milliseconds. Microwave links travel through air rather than glass on a nearly straight path, and by 2014 had cut the round trip to about 8.1 milliseconds, pressing against the limit the speed of light sets. Firms rebuilt a continental telecom route because glass bends light five milliseconds too slowly.
The box. At the exchange end, decisions live in silicon. On the industry's STAC-T0 benchmark, FPGA systems turned a market-data packet into an order in 98 nanoseconds back in 2017; the current published record is under 14 nanoseconds. Software on a CPU cannot compete in the reflex layer, so the reflex layer moved to hardware, with the models from the previous sections setting the parameters the hardware enforces.
None of this infrastructure generates edge by itself. It protects the edge the math earns, quote by quote, against everyone else who bought the same defenses.
What Actually Broke in July Was Not the Machine
Now the news, with the mechanism fresh in mind.
Jane Street was an early backer of Situational Awareness, the AI-focused hedge fund run by ex-OpenAI researcher Leopold Aschenbrenner. The fund was spectacular on the way up: up 439% for the year through June, up more than 1,000% since launching in mid-2024, peaking around 45 billion USD in assets at the start of July, running leverage reported as high as 400%.
Then AI infrastructure stocks rolled over. The fund's top disclosed positions, names like Nebius, Sandisk, Micron, and CoreWeave, each fell more than 35% inside the month. At 400% leverage, a levered long book does not get to wait out a drawdown: margin calls arrived, and the fund's public portfolio, reported down about 67% in July, was sold in a distressed sale to Citadel. Assets went from 45 billion to roughly 10, about half of which is a private Anthropic stake. Aschenbrenner's late-July letter framed the selloff as a major buying opportunity; the mark on the books said what it said.
Jane Street's 15 billion USD July came from that stake plus what Fortune described as wrong-way bets in Asian equity markets. A partner told staff, in a line that will age well or badly, "July was a bad month". The firm says the Situational Awareness position is flat on the year and still up over the life of the investment, and that much of the risk in the areas that lost money has since been cut.
Two different businesses sharing one name. The desk had a record year; the balance sheet had a July.
Look at what did and did not happen. The quoting machine, the thing this article described, produced more than 40 billion of net trading revenue in seven months, out-earning the loss even in the year of the loss. What lost 15 billion was the balance sheet: a large, illiquid, directional investment in a levered fund, plus directional books held over a month. Market-making risk is measured in ticks and seconds and controlled by reservation prices and skew. Investment risk is measured in months and billions and controlled, if at all, by position sizing. In July, the firm that runs one of the best versions of the first business took its historic loss in the second.
That is not an indictment of anyone; a firm earning 40 billion a year must park capital somewhere, and concentrated early bets sometimes pay 1,000% first. But the distinction is the entire lesson. The spread machine and the investment book do not share a risk model, and the month one of them finally printed red, it was not the one everybody watches.
What This Means For You
1. Market-making profitability is structural, not psychic. The desk earns a priced insurance premium at enormous frequency. If you can explain h∗=πJ and why risk halves when quotes lean against inventory, you understand more than most commentary on the subject.
2. The models are learnable, and they are the interview. Glosten-Milgrom and Avellaneda-Stoikov are two short papers, and quoting, skew, and adverse selection questions are standard in quant trading interviews. The simulations in this article are a few dozen lines of NumPy each; rebuilding them is a weekend well spent.
3. Speed is an insurance bill, not a magic trick. Colocation, microwave, and FPGAs defend quotes against being the slowest counterparty at the moment of news. If your strategy does not rest quotes, you are not in that race, and most of the microstructure that matters to you is about impact, not nanoseconds.
4. The risk that gets you is the one your best system does not cover. The cleanest P&L stream in finance sat next to a single position that erased four months of it. Diversification of business lines is not diversification of risk models.
If the mechanics here clicked, the natural next step is to build the other side of the coin: Build an Execution Algorithm: VWAP with Market Impact puts you in the shoes of the trader crossing the spread, implementing VWAP and Almgren-Chriss impact models in the browser. This breakdown stays free; the roadmap that sequences the build half lives at quantframe.io.
End of entry
Found this useful?
Likes decide what gets written next.Sign in to like
QuantFrame
Liked this article?
QuantFrame teaches you the math, code, and projects to break into quant. Plus a personalized roadmap built for your background and goals.