High-Flyer, the fund behind DeepSeek, returned 57%. Lingjun Investment hit 73%. The average Chinese quant fund posted 30.5%, more than double their Western counterparts.
The usual explanations don't satisfy me. "They have more data." "They trade a less efficient market." "They work harder." These are vibes, not insights.
I wanted to know what they're actually doing differently. So I went digging through the research coming out of Chinese universities. And I found something interesting.
The Paper That Caught My Attention
Researchers at Shanghai Jiao Tong University, one of China's top engineering schools, the "MIT of China," published a paper at AAAI 2024 called MASTER. It stands for Market-guided Stock Transformer.
The claim: 47% improvement on portfolio metrics compared to all baselines.
That number made me stop scrolling. So I read the paper. Then I read it again. Then I pulled their code from GitHub and traced through every layer.
Here's what I found.
The Problem With Existing Models
Most stock prediction models treat each stock independently. You feed in AAPL's price history, get a prediction. Feed in MSFT, get another prediction. Maybe you add some market indicators as features.
The smarter models try to capture correlations between stocks. Tech stocks move together. Banks move together. When NVDA rips, AMD often follows. This is useful information.
But here's what MASTER's authors noticed: these correlations aren't static.
In a calm market, AAPL and MSFT might move independently, driven by their own earnings, their own news. But when volatility spikes, suddenly everything becomes correlated. The whole market moves as one.
Existing models either ignore correlations entirely or assume they're fixed. Neither is true.
The Key Insight
MASTER does something clever. It uses current market conditions to decide how much attention to pay to correlations.
When the market is calm, the model focuses on each stock's individual patterns. When the market is stressed, it shifts attention toward cross-stock relationships.
This isn't just a theoretical improvement. It's how professional traders actually think. In a crisis, you stop caring about individual company fundamentals and start thinking about risk-on/risk-off, sector rotation, and contagion effects.
The model learns this behavior from data.
The Architecture
Let me walk through how MASTER actually works.
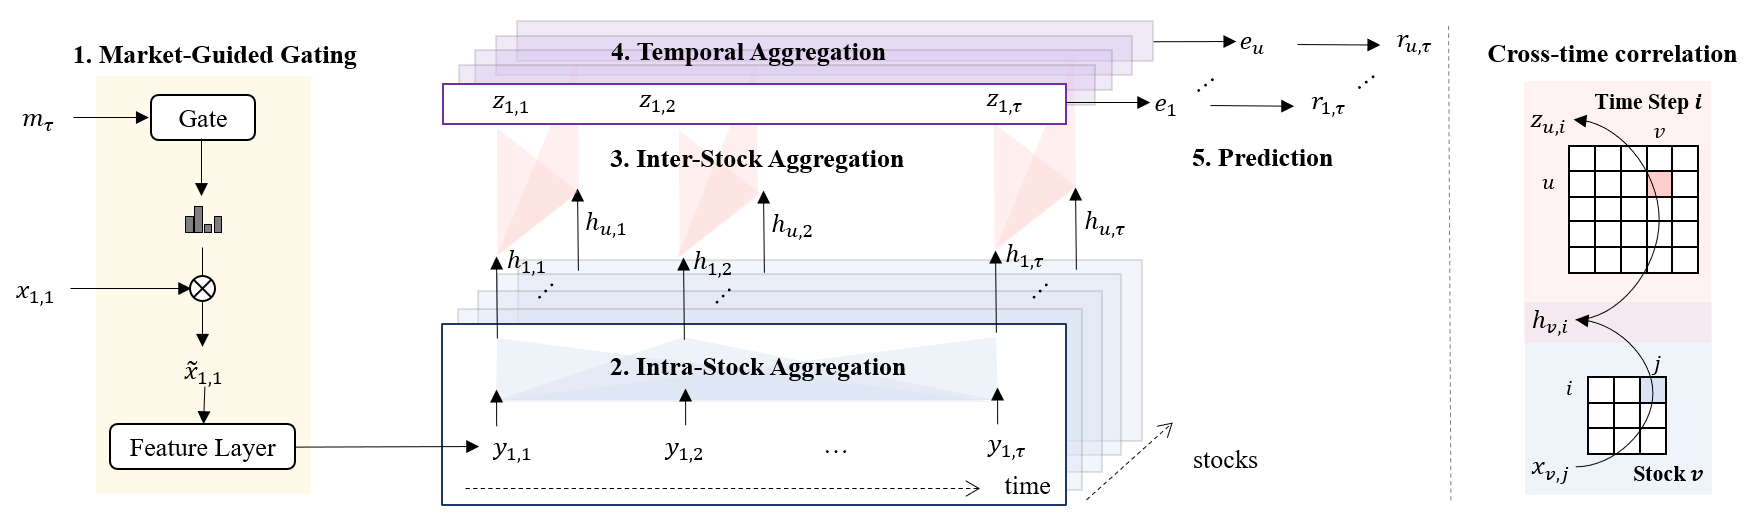
Input: For each trading day, you feed in N stocks, each with T days of history and F features. In their experiments: ~300 stocks, 8 days of lookback, 222 features.
Step 1: Market-Guided Gating
The model first looks at aggregate market features: index returns, volatility, trading volume across different time horizons. Based on this, it generates weights that determine which stock-level features are most relevant right now.
This is the "market-guided" part. The market context literally gates which features get through.
For each stock individually, transformer attention captures patterns across the 8-day lookback window. This is the model learning "AAPL's price action over the past week suggests..."
Now the model looks across all 300 stocks at each time step. Which stocks are behaving similarly right now? Which are diverging? This captures the cross-sectional structure.
Step 4: Temporal Pooling
The sequence gets compressed into a single representation per stock using learned attention weights.
Step 5: Output
Linear projection to a single number: predicted return.
The key is that steps 2 and 3 interact. The model learns momentary correlations (right now, these stocks are moving together) and cross-time correlations (when this pattern appeared before, these stocks followed).
The Gating Mechanism
The gating is where the magic happens. Let me show you conceptually how it works.
You have 222 stock-level features coming in. The market context generates a 222-dimensional weight vector through a softmax. Each feature gets multiplied by its corresponding weight.
In a high-volatility regime, the model might upweight momentum features and downweight mean-reversion features. In a calm market, the opposite.
This isn't hard-coded. The model learns which features matter in which conditions.
The spatial attention (across stocks) is where you can actually see the model learning market structure.
In their paper, they visualize the attention weights. You can literally see the model discovering that semiconductor stocks attend to each other. Energy stocks cluster. Defensive stocks form their own group.
But the pattern changes based on market conditions. During the COVID crash, the clusters dissolved. Everything attended to everything. Correlations went to 1. The model captured this.
python
class SpatialAttention(nn.Module):
    """Attention across stocks at each time step"""
    def __init__(self, d_model, n_heads):
        super().__init__()
        self.attn = nn.MultiheadAttention(d_model, n_heads)
        self.norm = nn.LayerNorm(d_model)
        self.ffn = nn.Sequential(
            nn.Linear(d_model, d_model * 4),
            nn.GELU(),
            nn.Linear(d_model * 4, d_model)
        )

    def forward(self, x):
        # x shape: (N_stocks, T, d_model)
        # Attend across stocks for each time step
        attn_out, weights = self.attn(x, x, x)
        x = self.norm(x + attn_out)
        x = self.norm(x + self.ffn(x))
        return x, weights  # weights show which stocks attend to which
What The Features Look Like
They use 222 total features:
158 stock-level factors: price-derived alpha factors. Things like momentum, mean reversion, volatility, volume patterns. Standard quant stuff.
63 market-level indicators: derived from three major indices. Return statistics and volume metrics across 5, 10, 20, 30, and 60 day horizons.
1 label: the target return to predict.
The market indicators are used for gating. The stock factors are what gets gated.
The Results
Tested on CSI 300 (top 300 Chinese A-shares) and CSI 800 (top 800):
Information Coefficient improved 15-20% over baselines
Sharpe ratio improved 25-35%
Annualized returns improved ~47% on CSI 300
The baselines aren't weak. They compared against LSTMs, Transformers, GATs, and other published stock prediction models. MASTER beat all of them.
The biggest gains came during volatile periods, exactly when the market-guided mechanism should help most.
What This Means For You
You're not going to clone this model and run it on Robinhood. The features alone require serious data infrastructure.
But the insights transfer:
1. Correlations are regime-dependent. Stop treating factor loadings as constant. Your momentum strategy that worked in 2023 might be correlated with completely different assets in 2025.
2. Market context should influence feature selection. If you're using a fixed set of indicators regardless of conditions, you're leaving edge on the table.
3. Cross-sectional and time-series information interact. Looking at one stock in isolation is leaving money on the table. Looking at cross-sectional correlations without considering how they evolve is also incomplete.
These Chinese researchers aren't doing magic. They're just being rigorous about things Western quants often hand-wave.
Try It Yourself
The code is open source.
MASTER repo: github.com/SJTU-DMTai/MASTER
They provide pre-trained models and processed data for CSI 300 and CSI 800. You can run inference immediately if you want to see it work.
If you want to adapt it to US markets, you'll need to reconstruct the 222 features yourself. That's a project. But the architecture is all there.
The Bigger Picture
I don't think MASTER is why Chinese quant funds are outperforming. That's a complex story involving market structure, competition, and regulation.
But I do think papers like this show the quality of research coming out of Chinese institutions. SJTU, Tsinghua, Peking: these schools are producing world-class quant research. If you're only reading papers from Stanford and MIT, you're missing half the field.
The next edge might not come from Silicon Valley. It might come from Shanghai.
This is the kind of research that separates serious quants from hobbyists. If you want to actually implement these ideas, QuantFrame gives you the math foundations, coding problems, and projects to get there. Your roadmap is waiting.
End of entry
Found this useful?
Likes decide what gets written next.Sign in to like
QuantFrame
Liked this article?
QuantFrame teaches you the math, code, and projects to break into quant. Plus a personalized roadmap built for your background and goals.