Four GitHub repos, all free and open source. A formula finder from an astrophysicist, a Hawkes process library from École polytechnique, an Oxford econometrician's toolkit, and a scikit-learn add-on for prediction intervals.
Each one does a research job a quant fund pays people to do: find the model, model the order flow, check the backtest isn't luck, and put an honest range around the forecast.
For each one: what it does, the research behind it, and the link. At the end: how the four fit into one research loop.
PySR Finds the Formula Instead of Fitting a Black Box
You give PySR data and it searches for an actual formula that fits, built from operators you allow. What comes out is an equation you can read, not a black box. Miles Cranmer, now at Cambridge's Institute of Astronomy, built it for science.
In March 2026 Martin Keller-Ressel and Hannes Nikulski at TU Dresden pointed it at S&P 500 implied volatility from January 2005 to December 2023. Their benchmark was SVI, the smile formula devised at Merrill Lynch in 1999, which writes total implied variance w as a function of log-moneyness k:
w(k)=a+b(ρ(k−m)+(k−m)2+s2)
PySR found formulas that fit the smile better than SVI and are simpler. SVI scores 15 on PySR's complexity count. The simplest formula that beat it scores 10.
A Hawkes process is a model where every event makes the next one more likely for a while. The rate of events at time t is a base rate plus a bump from each past event:
λ(t)=μ+∑ti<tϕ(t−ti)
Seismologists use the same model for aftershocks. Order flow behaves in a similar way, since one order triggers the next.
tick, from École polytechnique's Data Science Initiative, fits these models fast. Its own paper fits both an earthquake catalogue and the Bund futures order book. On the Bund, the fitted kernels show which events trigger which: price moves up, price moves down, and market orders at the bid or ask that don't move the price.
arch Tells You Whether Your Best Backtest Was Luck
arch is named after the ARCH and GARCH volatility models it fits, and that's what it is known for. Its bootstrap module also answers the question every backtest ends on: did your best strategy beat the benchmark, or did it just get lucky?
Try 500 parameter combinations and some will look great by chance. Hansen's SPA test, Romano and Wolf's StepM and the Model Confidence Set all correct for how many you tried. Kevin Sheppard, a financial econometrician at Oxford, maintains it.
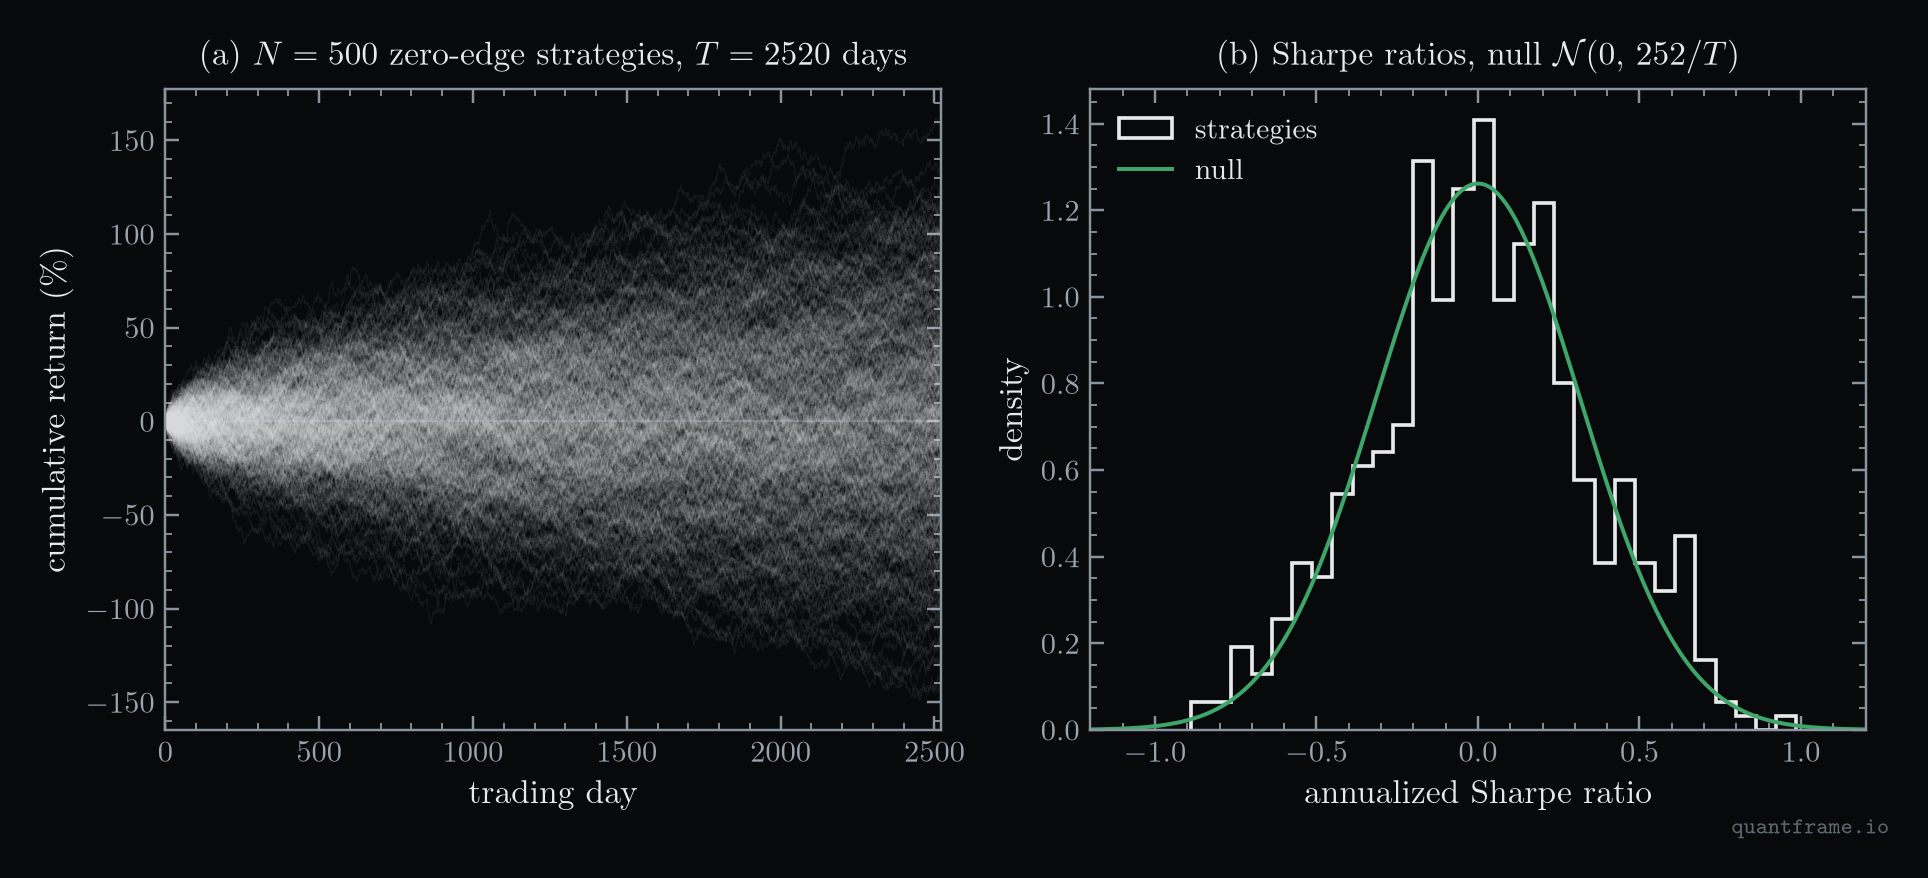
So I gave it 500 strategies with no edge at all, ten years of pure noise each.
500 strategies, every true Sharpe ratio exactly zero. The histogram sits right on the null curve, and the luckiest of them still shows a Sharpe of 0.99.
The best one had a Sharpe ratio of 0.99 and a single-test p-value of 0.0009. 39 of the 500 pass a 5% test on their own. SPA gives the best one a p-value of 0.32, and StepM finds no strategy that beat holding cash.
MAPIE wraps any scikit-learn model and gives you a range instead of a single number, built to contain the real value a set share of the time. The method underneath, conformal prediction, normally assumes tomorrow looks like the past.
Market data breaks that, so MAPIE has time series methods, EnbPI and ACI, that adjust the range based on recent misses. ACI's whole update is one line. With α the target miss rate and errt=1 when the last range missed:
αt+1=αt+γ(α−errt)
A miss lowers αt, which widens the next range, so the range widens after a shock. Isaac Gibbs and Emmanuel Candès, who wrote ACI, tested it on the stock volatility of Nvidia, AMD, BlackBerry and Fannie Mae. The non-adaptive version failed to cover Fannie Mae's volatility.
Line them up and they make one research loop. PySR proposes the model, tick models the order flow it trades in, arch checks the result isn't luck, and MAPIE puts a range on the forecast that stays honest when the market shifts.
None of them hands you a strategy. They make the research honest, and the edge is still your job.
Two of the foundations are on QuantFrame. The Poisson process that a Hawkes process extends is in Stochastic Processes, and the multiple testing trap that arch's tests fix is in Statistical Computing, where twenty noise signals produce a fake winner in front of you.
The repos are free. When you want the maths to use them properly, your roadmap is waiting at quantframe.io.
End of entry
Found this useful?
Likes decide what gets written next.Sign in to like
QuantFrame
Liked this article?
QuantFrame teaches you the math, code, and projects to break into quant. Plus a personalized roadmap built for your background and goals.