The Hedge Fund Paper Trail: Four Free Datasets That Show the Positions
Antonije Mirkovic·10 min read
hedge funds · market data · short selling · cftc · sec filings
Hedge funds file paperwork. Not press releases, not 13F snapshots from 45 days ago, but positions: their futures book every week, their shorts with their name attached, their activist stakes with the thesis written out, their prime brokers and auditors on the record.
All of it is public. All of it is free. Almost nobody reads it.
I pulled all four datasets this week, raw, from the regulators that publish them. This article is the map: what each one actually contains, the exact link, how stale it is when you see it (the honest answer ranges from one day to fifteen months), and what breaks if you trust it blindly.
The COT Report Is the Hedge Fund Bucket, Three Days Late
Every week the CFTC publishes how every category of large trader is positioned in US futures. The report that matters for hedge funds is the Traders in Financial Futures report, and its "Leveraged Funds" column is the hedge fund bucket by the CFTC's own definition: "typically hedge funds and various types of money managers, including registered commodity trading advisors (CTAs); registered commodity pool operators (CPOs) or unregistered funds identified by CFTC."
The mechanics: positions are recorded every Tuesday and published Friday at 3:30 pm Eastern, with holiday weeks shifting the release. Three days late, every week, back to June 2006. The US Office of Financial Research thinks enough of this dataset that it sits in their own Hedge Fund Monitor.
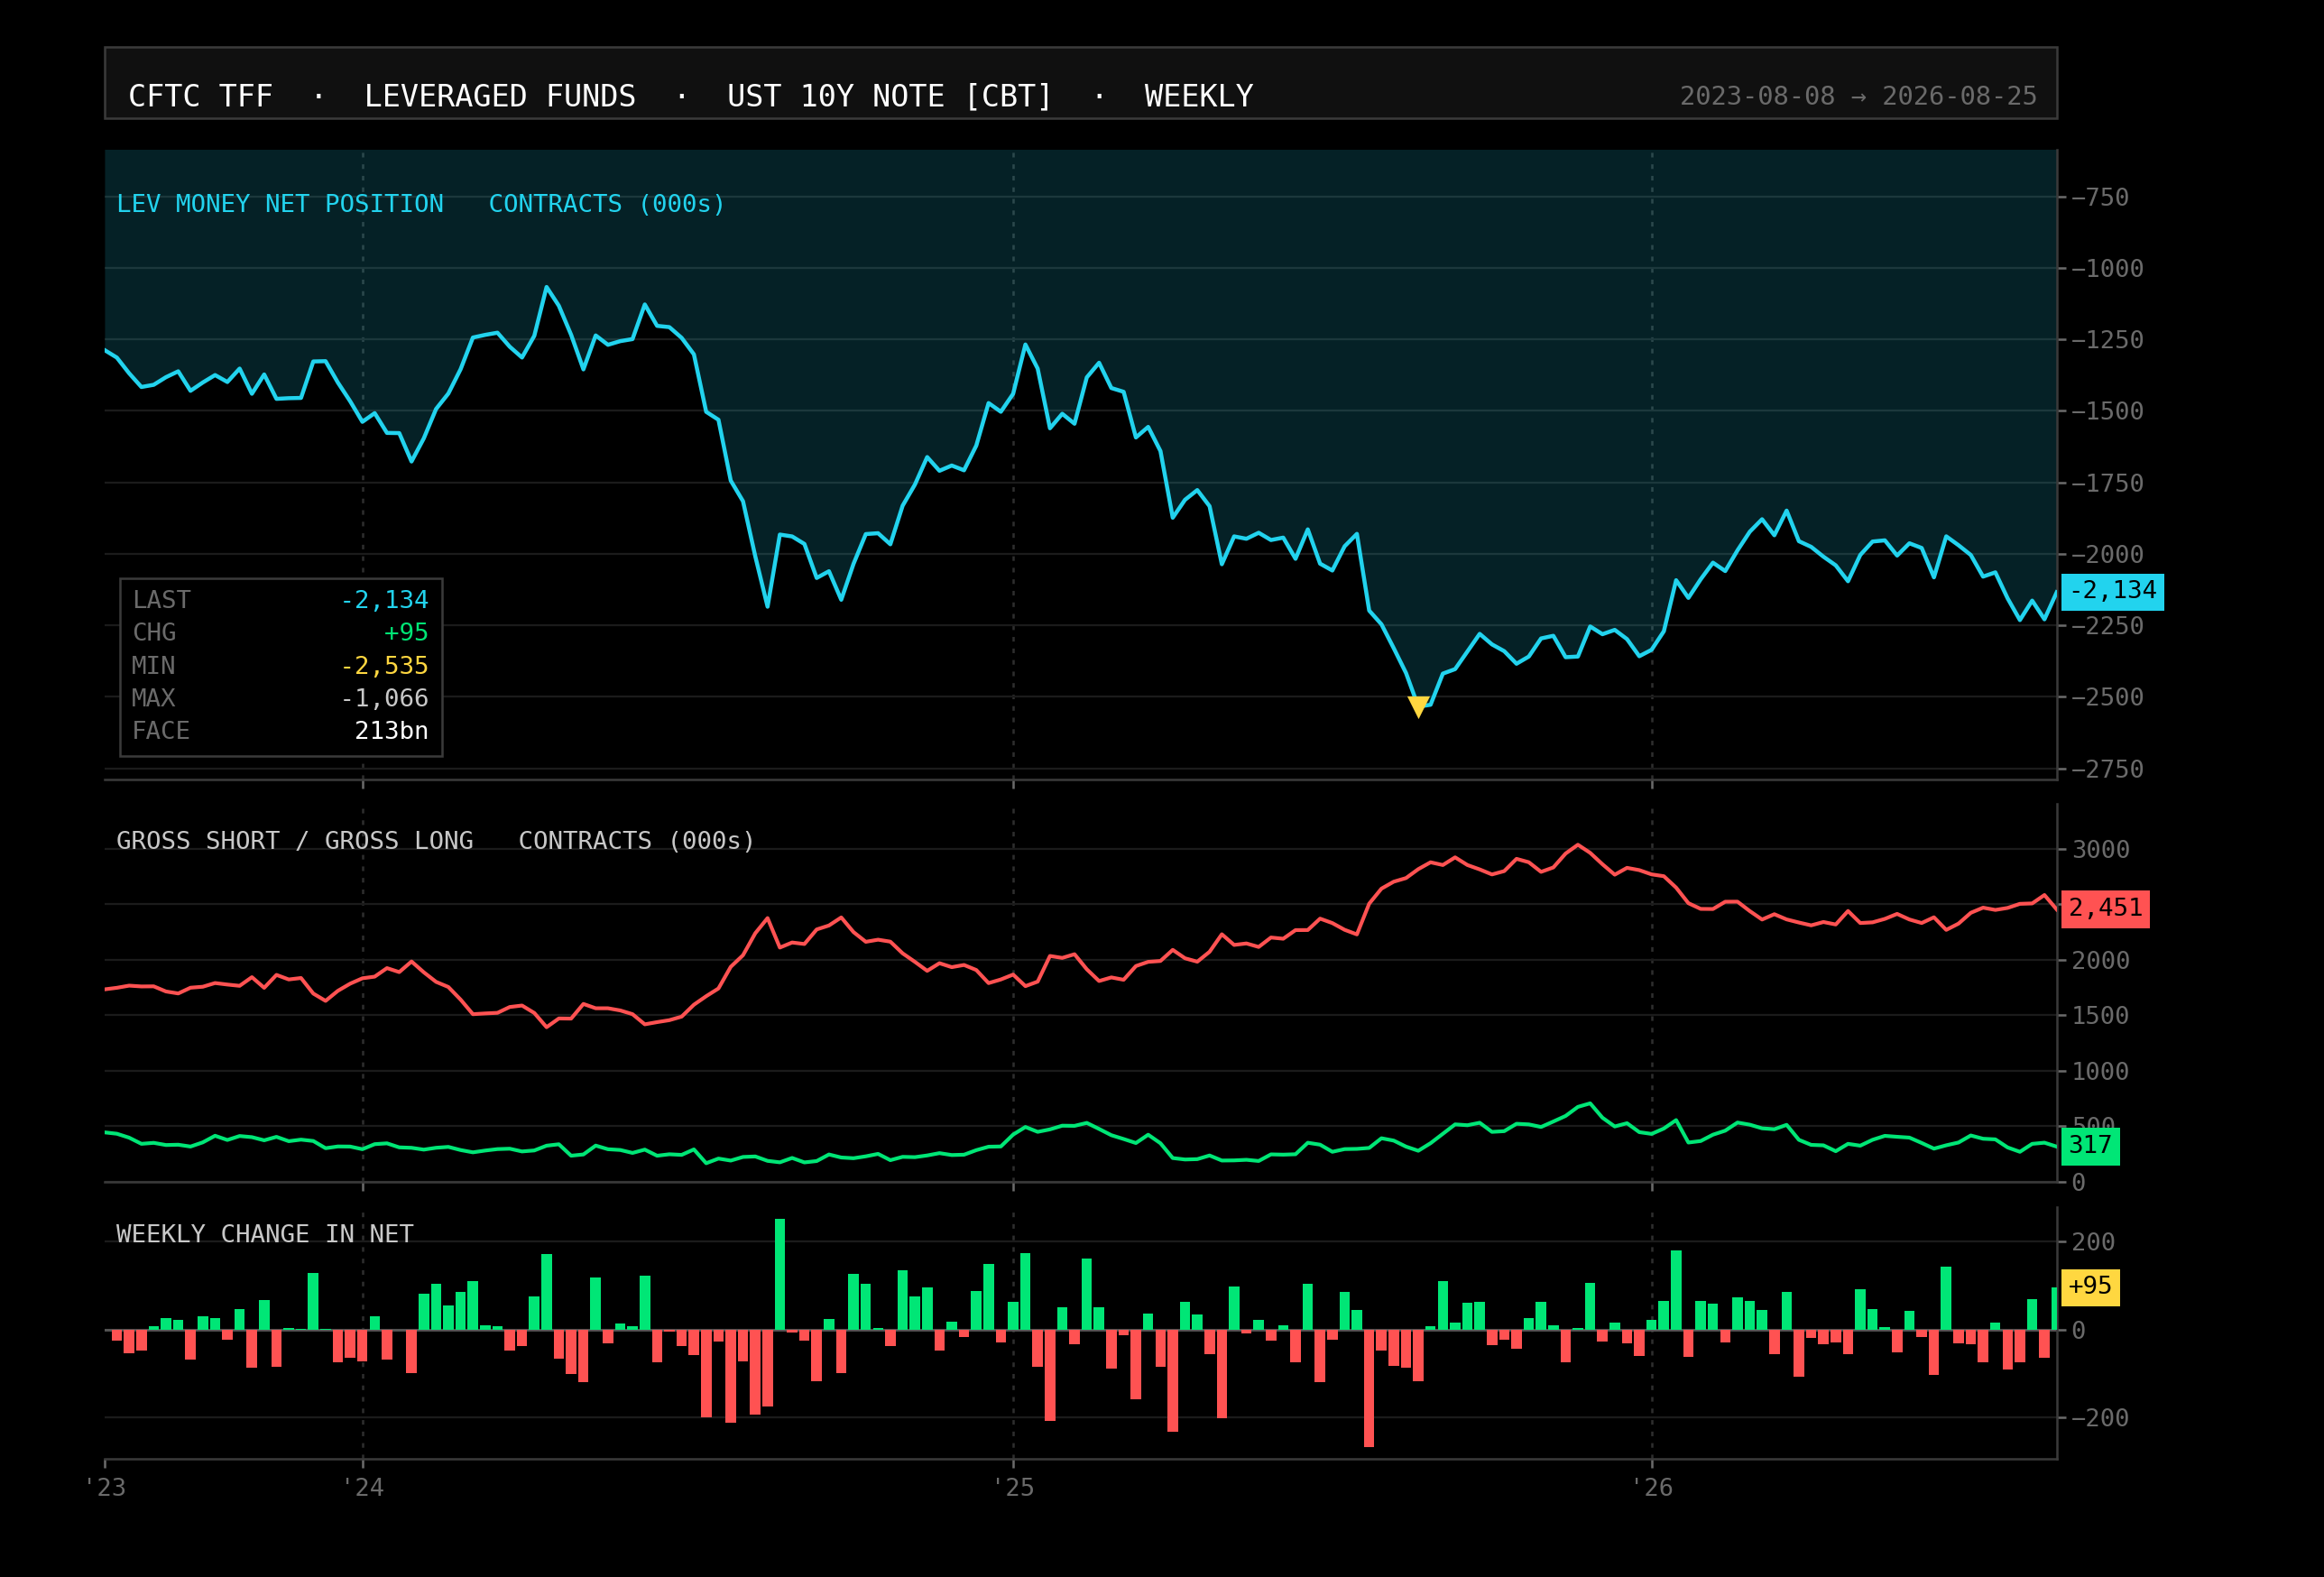
Leveraged funds in the 10Y Treasury note future. I rebuilt this from the raw weekly file and every number on it reproduces: net short 2,134,000 contracts, 213 billion USD of face.
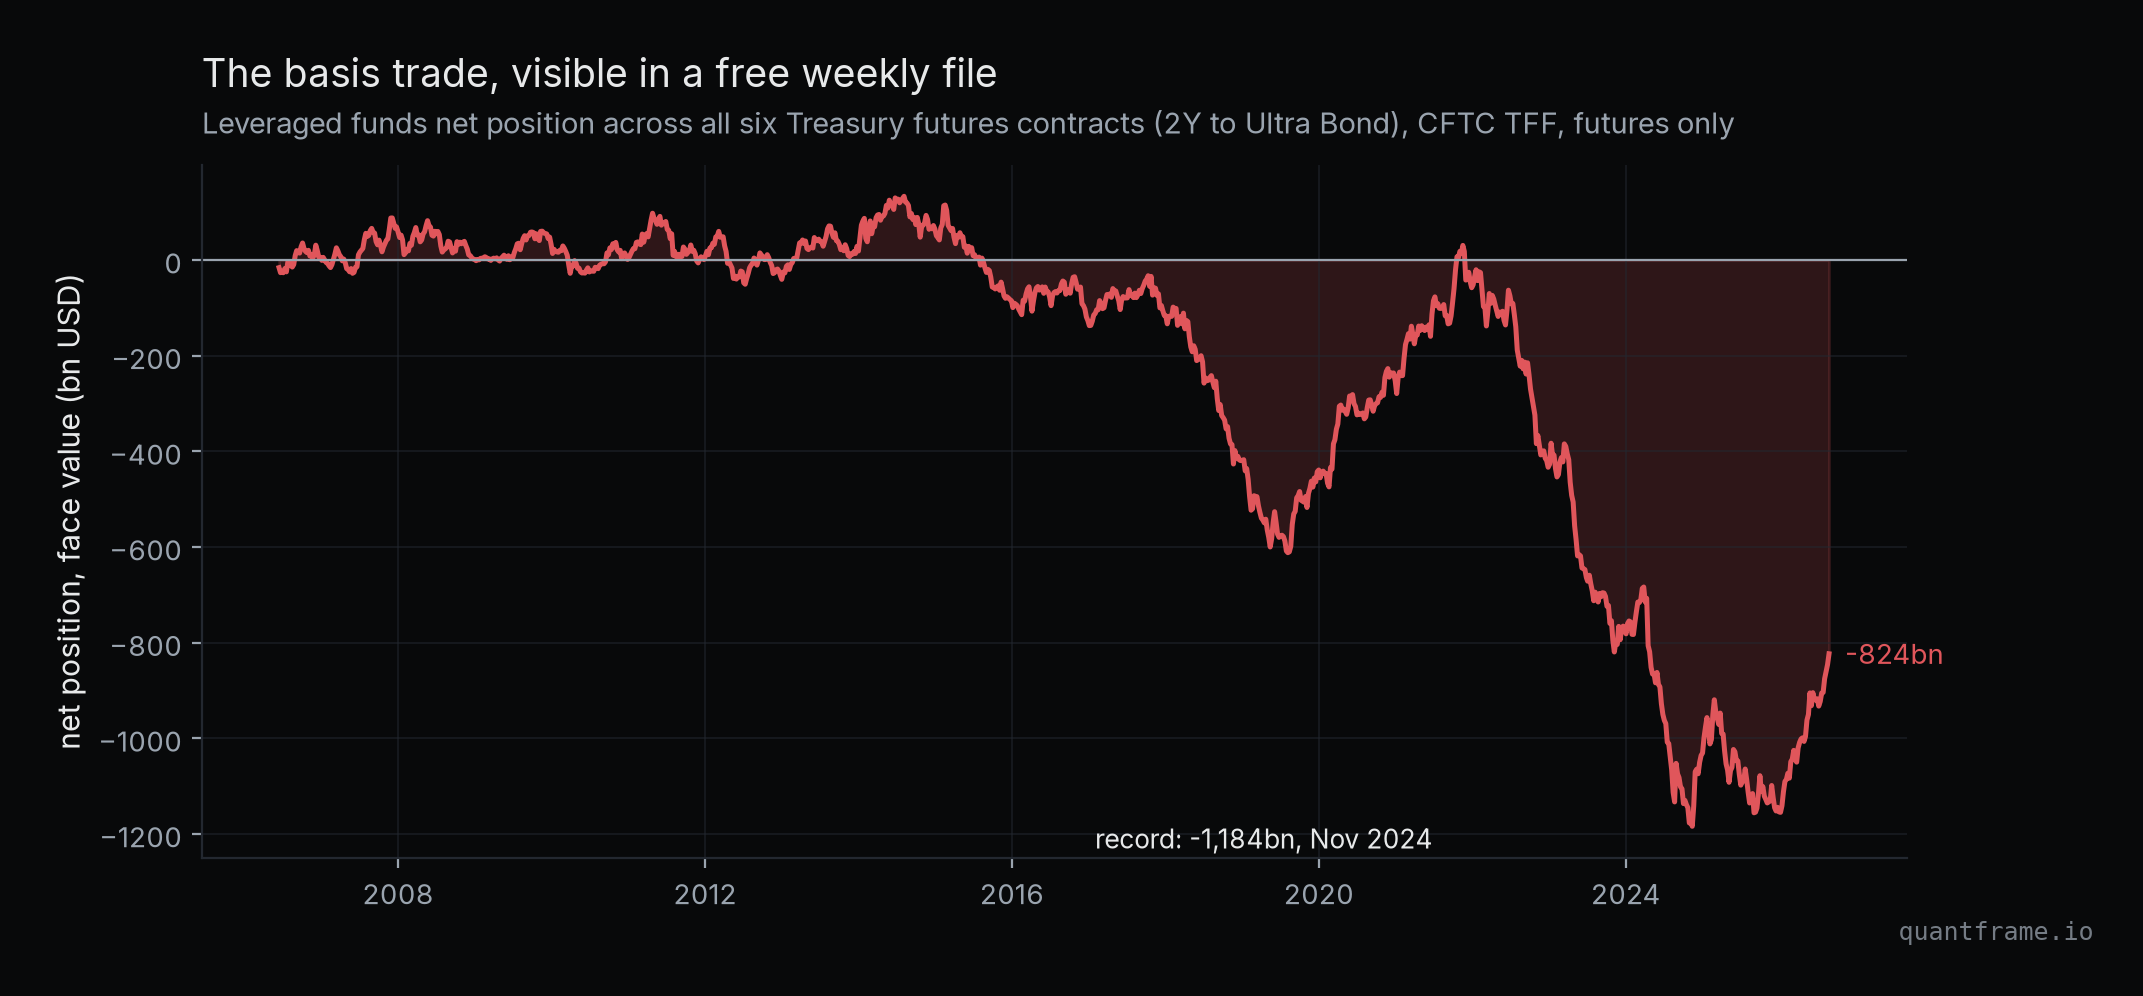
This is where the Treasury basis trade lives in public view. The trade is short futures against long cash bonds, and its short leg sits in the leveraged funds column of the Treasury contracts. Not every contract in that column is a basis trade, an outright duration short looks identical in this data, but it is the series official-sector monitors watch for exactly this purpose. Load all six contracts, from the 2Y note to the Ultra Bond, multiply by face value, and you can watch a trillion-dollar trade breathe:
cot.pypython
import io
import pandas as pd
import requests

url = "https://www.cftc.gov/files/dea/history/fut_fin_txt_2026.zip"
raw = requests.get(url, headers={"User-Agent": "research you@example.com"})
tff = pd.read_csv(io.BytesIO(raw.content), compression="zip", low_memory=False)
ten_year = tff[tff["Market_and_Exchange_Names"].str.strip()
               == "UST 10Y NOTE - CHICAGO BOARD OF TRADE"]
net = (ten_year["Lev_Money_Positions_Long_All"]
       - ten_year["Lev_Money_Positions_Short_All"])
Six contracts, one trade, twenty years of tape. The 1.18 trillion USD short of November 2024 is the record for the dataset's entire history.
Across the whole complex, leveraged funds were net short 1,184 billion USD of face value at the November 2024 peak. As of the latest report it stands at 824 billion, and the week-by-week changes tell you whether the trade is building or unwinding, three days after the fact.
What the dataset will not give you: names. Every number is an aggregate across the category, one snapshot per week, futures and options on futures only. A fund's cash bonds, swaps and repo, the other legs of the same trade, are invisible here. You are reading the category's footprint, not anyone's book.
The United States does not publish who is short what: FINRA's short interest is an aggregate per stock, and the SEC's incoming Form SHO data will be aggregated by security too, names withheld. The European Union publishes the fund's name on every line.
Under the EU Short Selling Regulation, anyone whose net short position reaches 0.5 percent of a company's issued shares is disclosed publicly, and again at every 0.1 percent step in either direction. The deadline is in the regulation's own words: "not later than at 15.30 on the following trading day." One day. It is the fastest dataset in this article.
Positions between 0.1 and 0.5 percent are reported too, but only to the regulator. The public register is the tip; the regulator sees the iceberg.
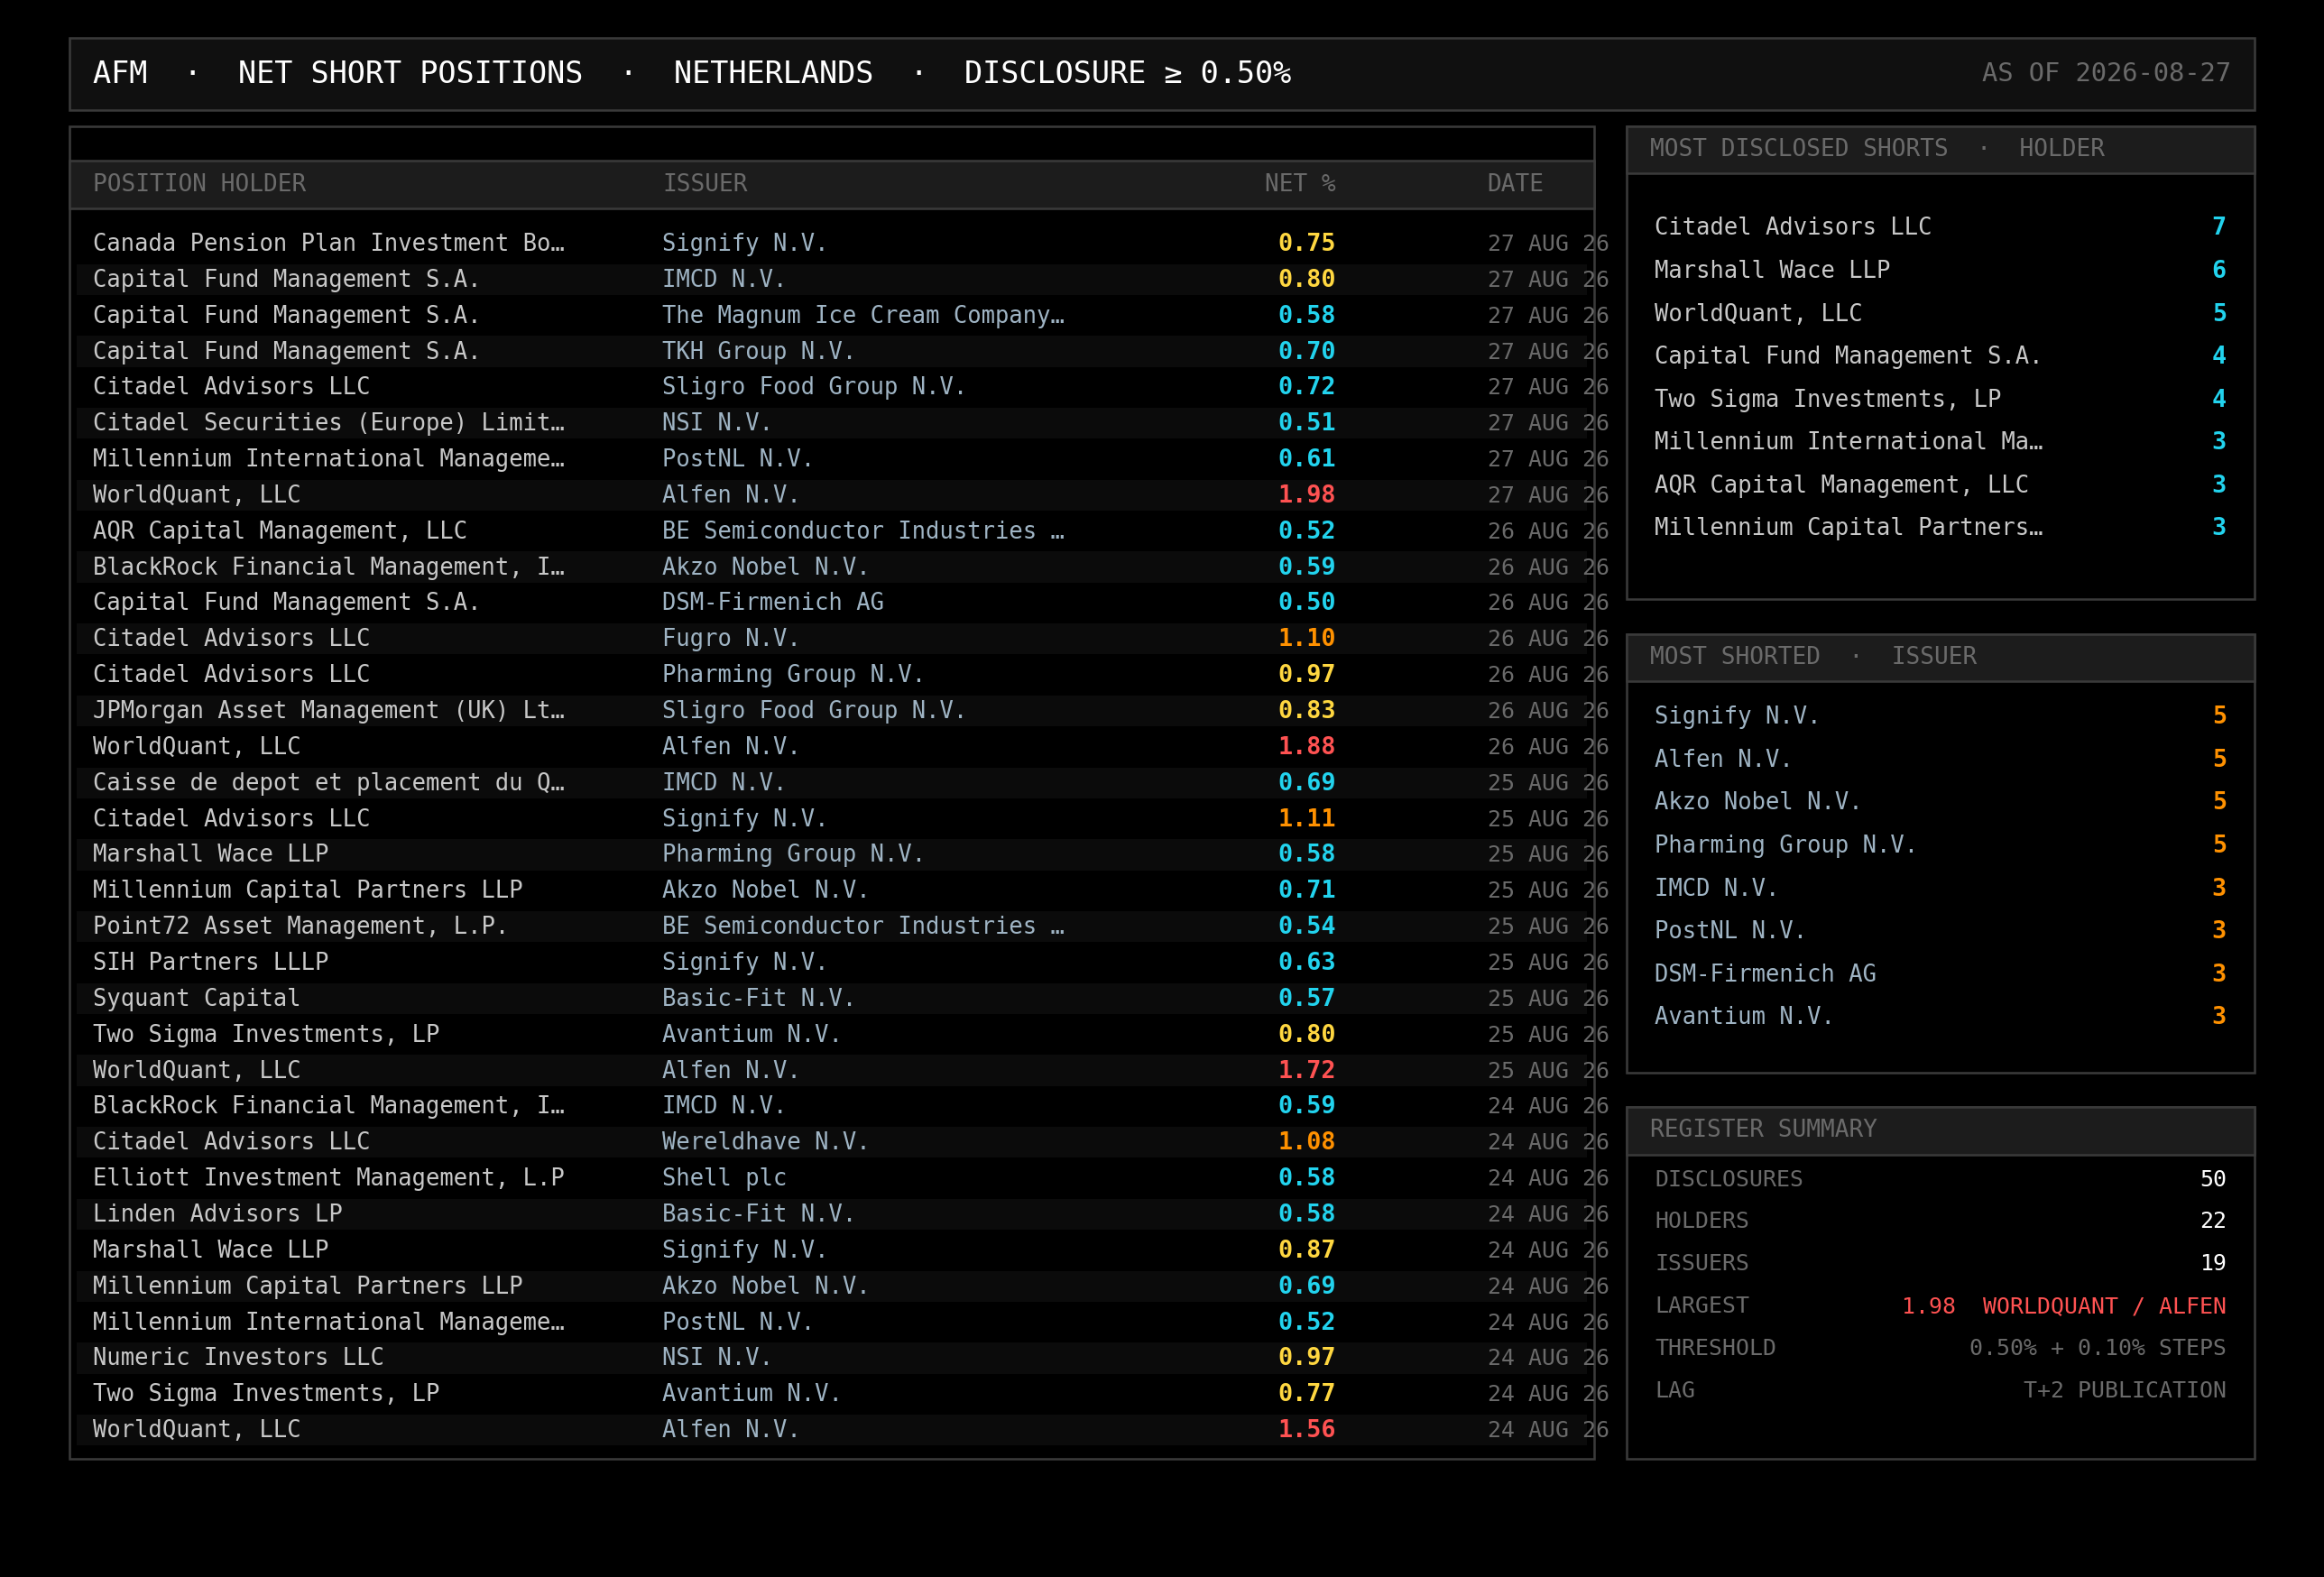
The Dutch register reads like a blotter: Citadel, Millennium, Two Sigma, WorldQuant, AQR, Point72, one row per disclosed short.
Each country runs its own register, which is the annoying part: there is no single EU-wide file. The Dutch one, run by the AFM, is the friendliest, with a CSV export and a full archive back to November 2012, the month the regulation took effect. Today's file: 778 disclosure rows, 47 position holders, 24 issuers, and the largest single position is Citadel Advisors at 2.42 percent of Signify.
afm.pypython
import io
import pandas as pd
import requests

base = "https://www.afm.nl/export.aspx?type={}&format=csv"
ua = {"User-Agent": "research you@example.com"}

def register(guid):
    raw = requests.get(base.format(guid), headers=ua).content
    return pd.read_csv(io.StringIO(raw.decode("latin-1")), sep=";")

current = register("8a46a4ef-f196-4467-a7ab-1ae1cb58f0e7")
history = register("3ca31b3d-23d9-4fa2-b846-29c7e3f0e5ff")  # 21,748 rows since 2012
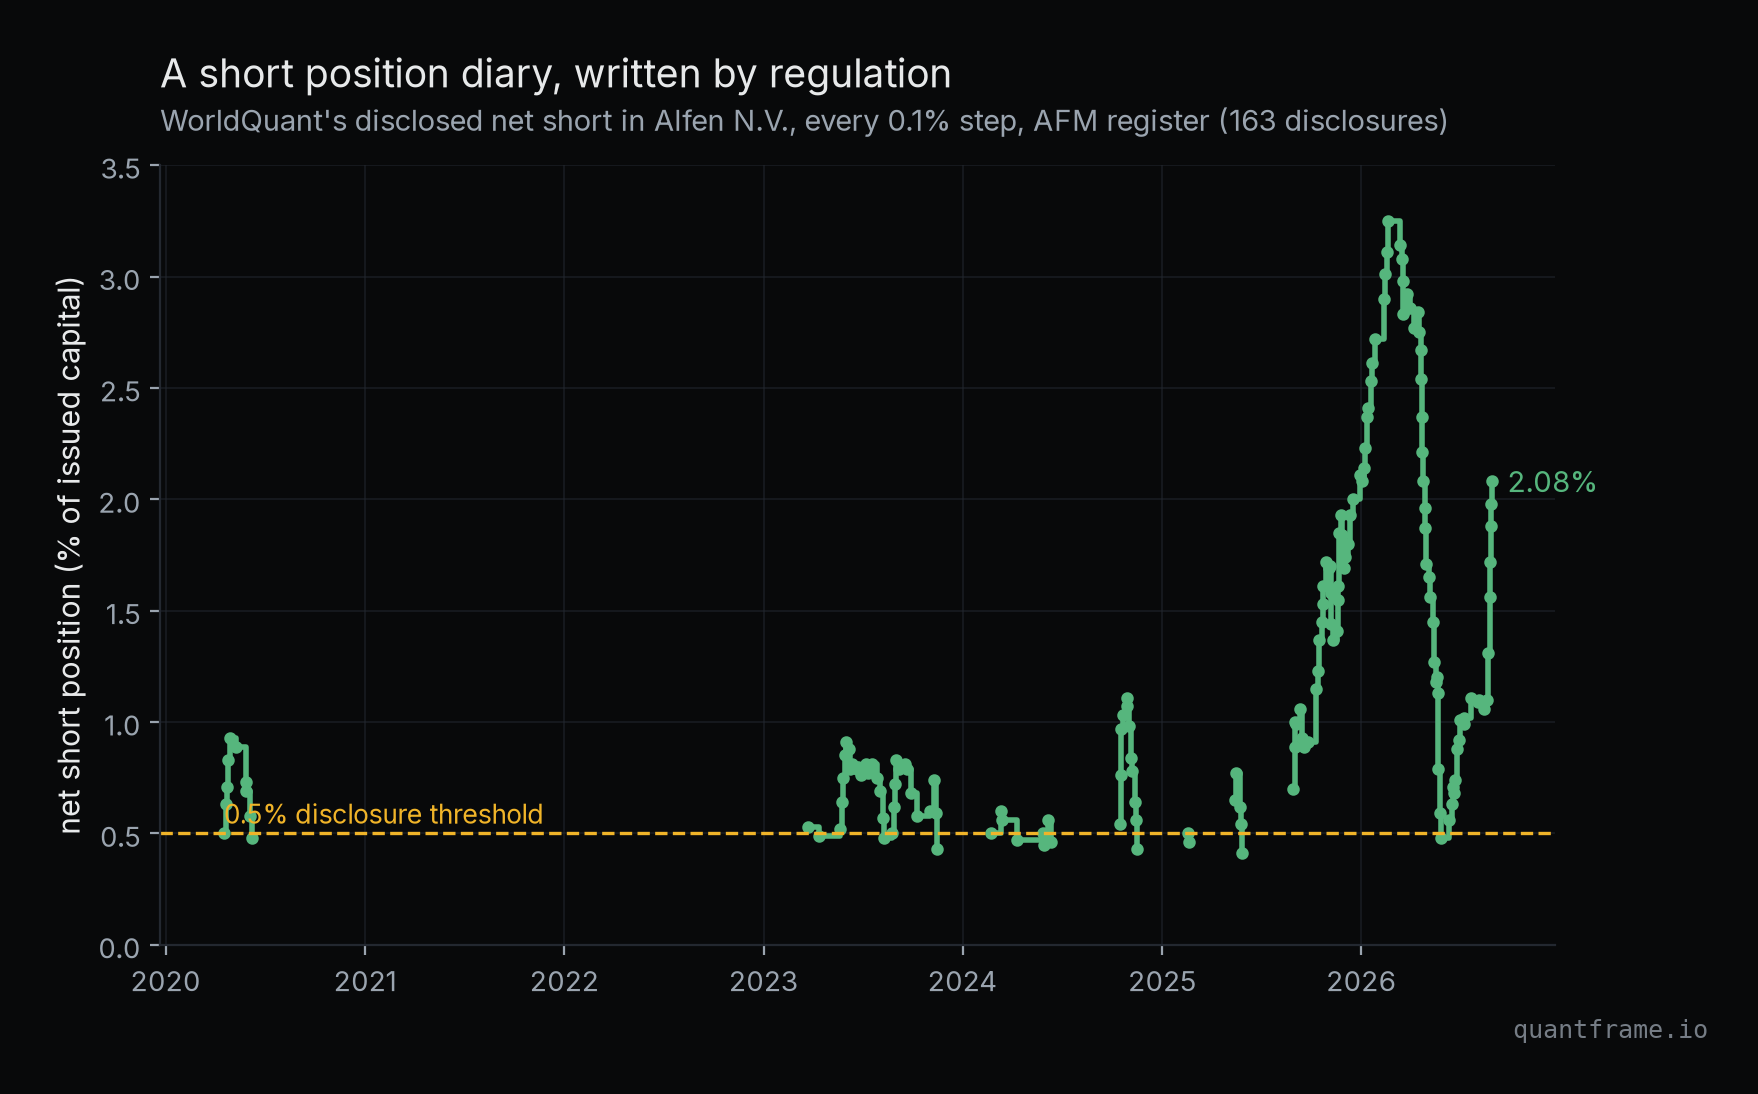
Because every 0.1 percent move above the threshold forces a new row, following one fund through the register gives you something remarkable: a position diary, timestamped by regulation. Here is WorldQuant in Alfen, a Dutch EV-charging company, reconstructed from 163 separate disclosures:
Conviction you can read off a chart: surfaced in 2020, invisible for two years, then built to 3.25 percent through 2026. The gaps are the position running below the 0.5 percent radar.
Steps up are conviction being added. Steps down are covering. And when several funds converge short on the same name, you are looking at crowding you can count: in today's Dutch register, eleven separate funds are at or above the 0.5 percent line in Signify and nine in Pharming, at the same time. That is squeeze-watching with primary-source data.
The restrictions are the mirror image of the strength. Anything below 0.5 percent is invisible to you. Market makers are exempt. And a fund can sit at 0.49 percent indefinitely, which is exactly what the silent stretches in the diary above are: the register tells you when a fund goes dark, but not what it does in the dark.
The Dutch register is at afm.nl (CSV button top right). Germany publishes through the Bundesanzeiger, France routes each disclosure through the AMF's BDIF database, and the post-Brexit UK equivalent is the FCA's daily short positions file.
Activists File the Thesis Themselves, Five Business Days Late
Cross 5 percent of a US public company with intent to influence it and you must file a Schedule 13D with the SEC. Since February 2024 the deadline is five business days, cut from ten calendar days, and amendments must land within two business days. The SEC's own chair explained the change plainly: "it shouldn't take 10 days for the public to learn about an attempt to change or influence control of a public company."
The document has a section the others in this article do not: Item 4, Purpose of Transaction. It is the one place in financial disclosure where a fund is legally required to state what it wants: board seats, a sale, a strategy change, a fight. The thesis, in the fund's own words, before the campaign plays out.
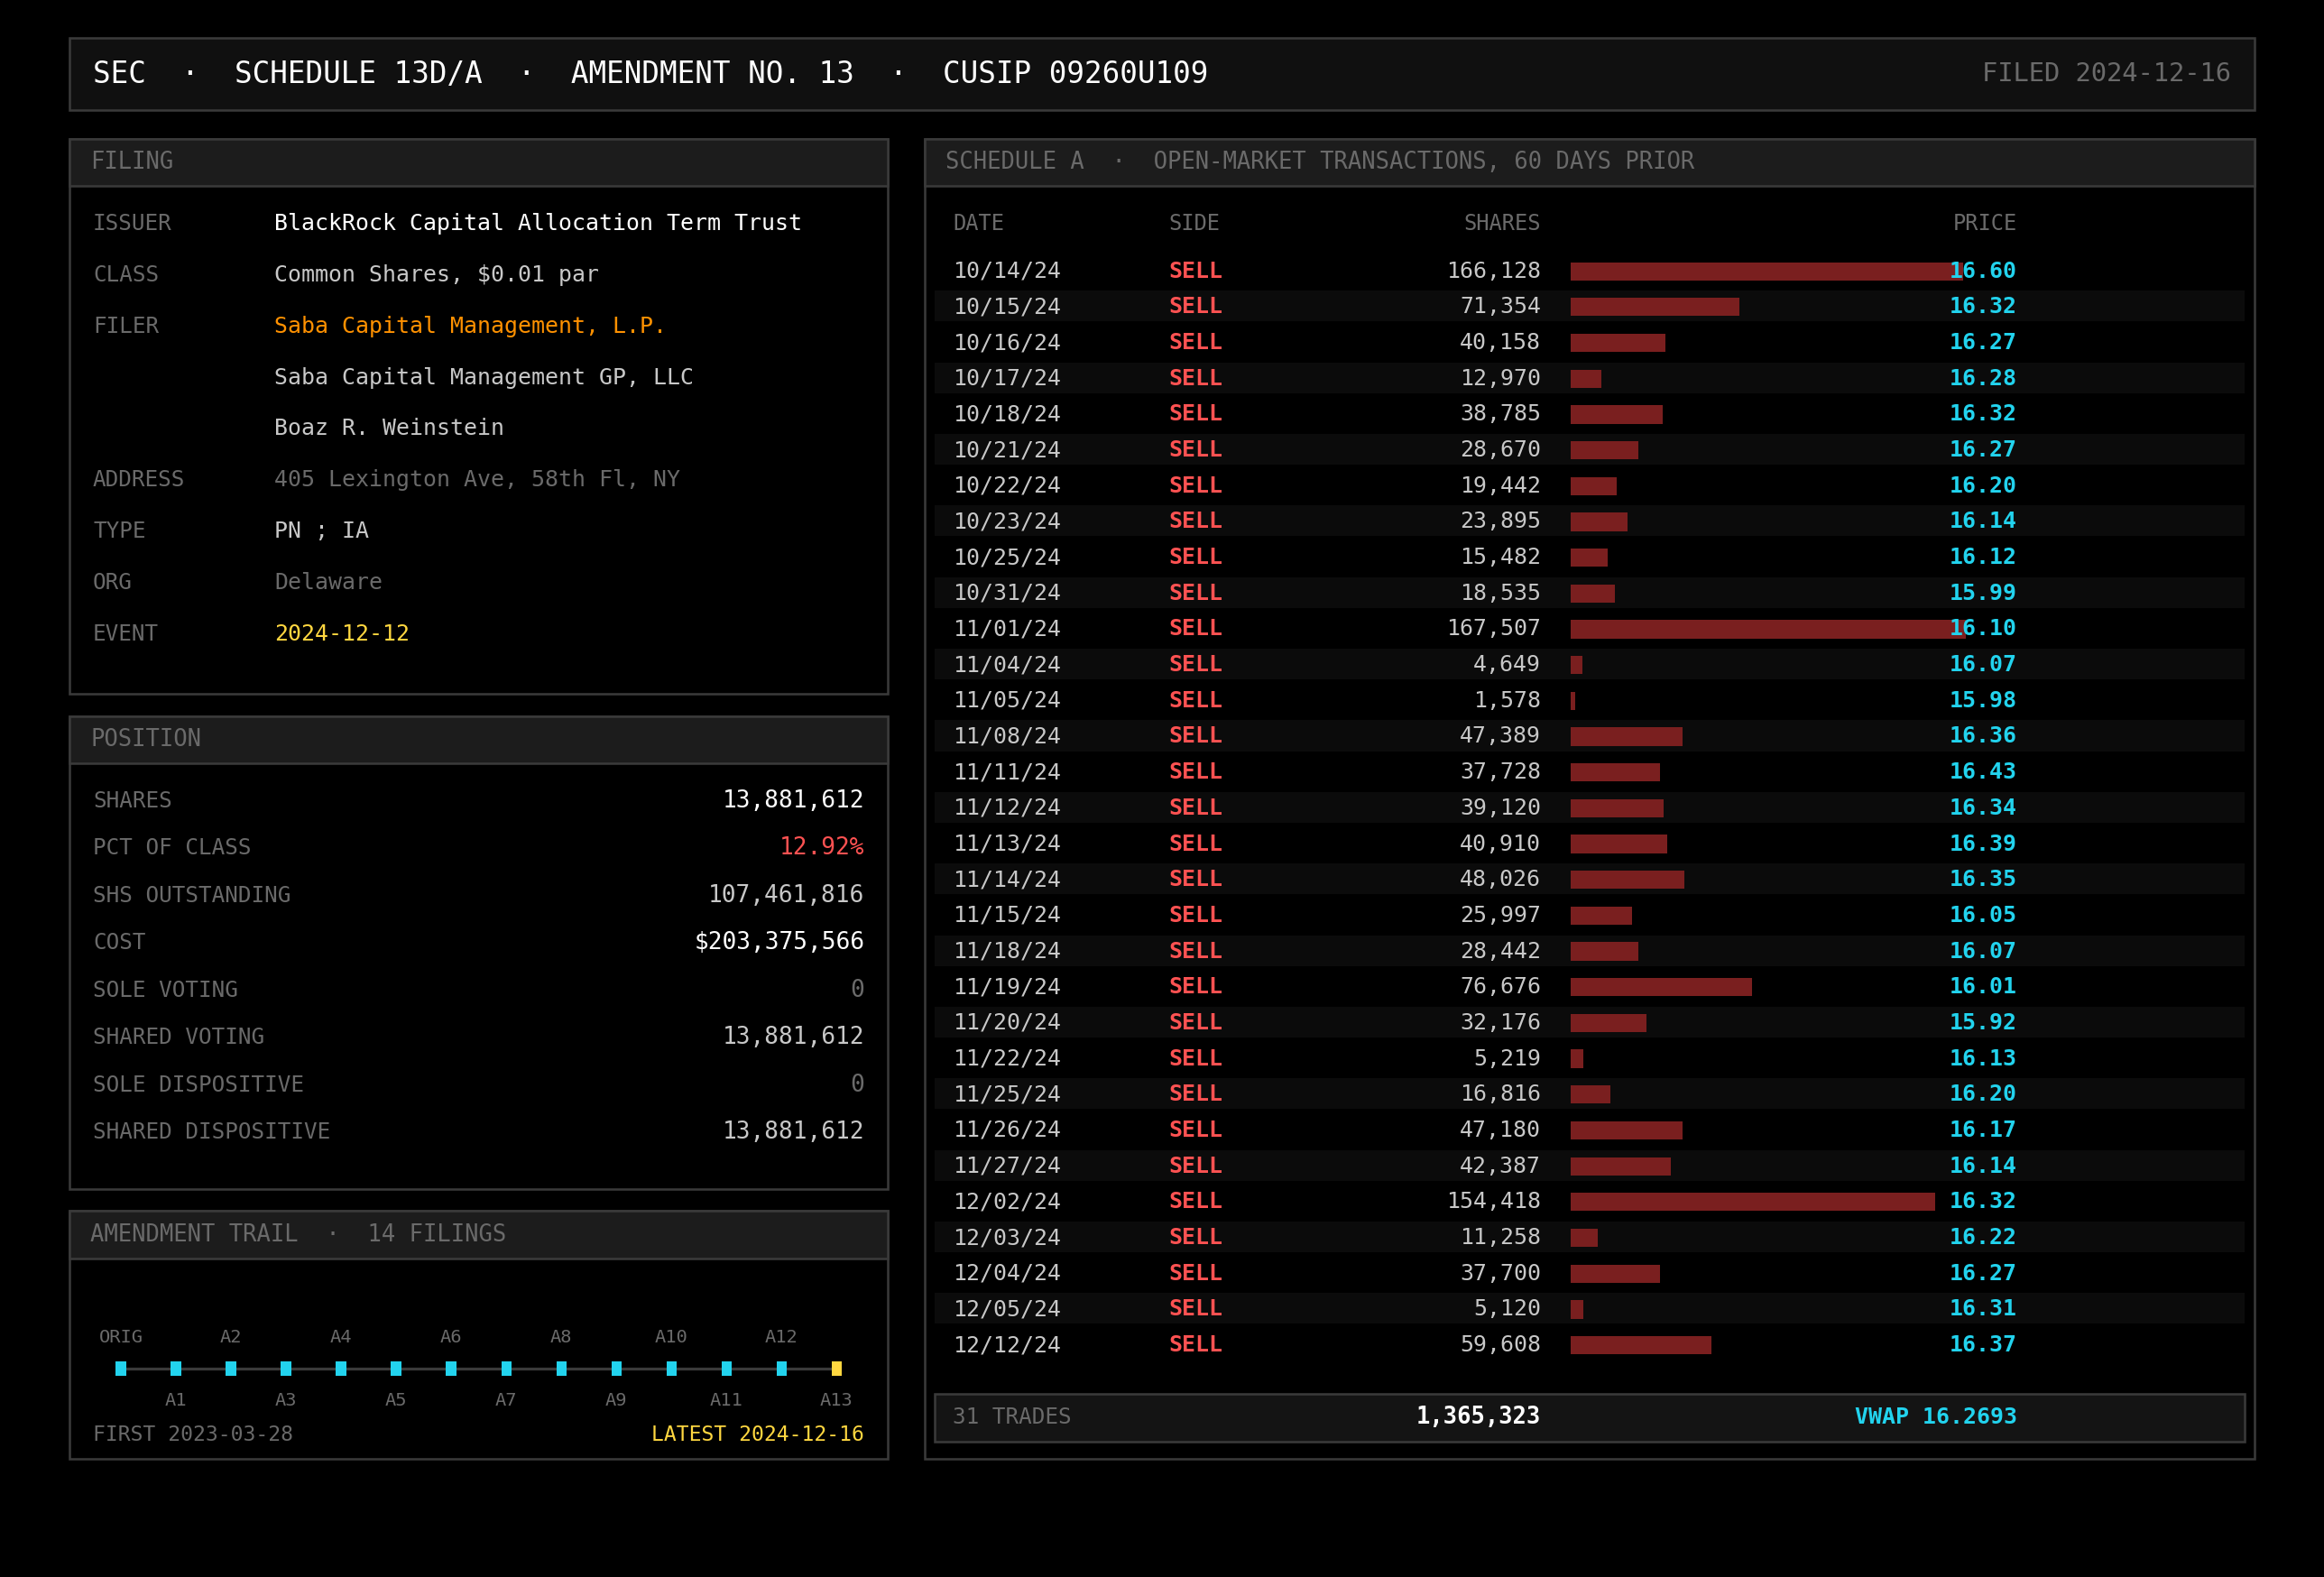
Amendment number 13 of Saba's campaign against a BlackRock closed-end fund, with every open-market trade itemized. The entire trail is on EDGAR.
The amendment trail is the underrated part. An initial 13D is a snapshot; the string of 13D/A amendments is a campaign log with transaction schedules attached, every purchase and sale with date, size and price. The example above is Saba Capital versus BlackRock Capital Allocation Term Trust: one original filing and thirteen amendments across two years, all free, all indexed.
Everything lands on EDGAR full-text search the moment it is filed, and since late 2024 the filings are machine-readable by mandate, which makes them trivially scrapeable:
edgar.pypython
import requests

r = requests.get(
    "https://efts.sec.gov/LATEST/search-index",
    params={"q": '"09260U109"', "forms": "SC 13D/A"},   # search by CUSIP
    headers={"User-Agent": "your-name your@email.com"}, # SEC requires this
)
filings = r.json()["hits"]["hits"]
The catches. Only stakes above 5 percent with control intent file 13D at all; passive holders file the slower 13G, and exposure built through cash-settled swaps generally does not count toward the 5 percent trigger, a gap the SEC addressed with guidance rather than a bright-line rule. And the position is up to five business days old when you first see it, which in a fast-moving name is a lifetime.
Form ADV Tells You Who They Are, a Year Late
The last dataset holds no positions at all, and it might be the most underused of the four.
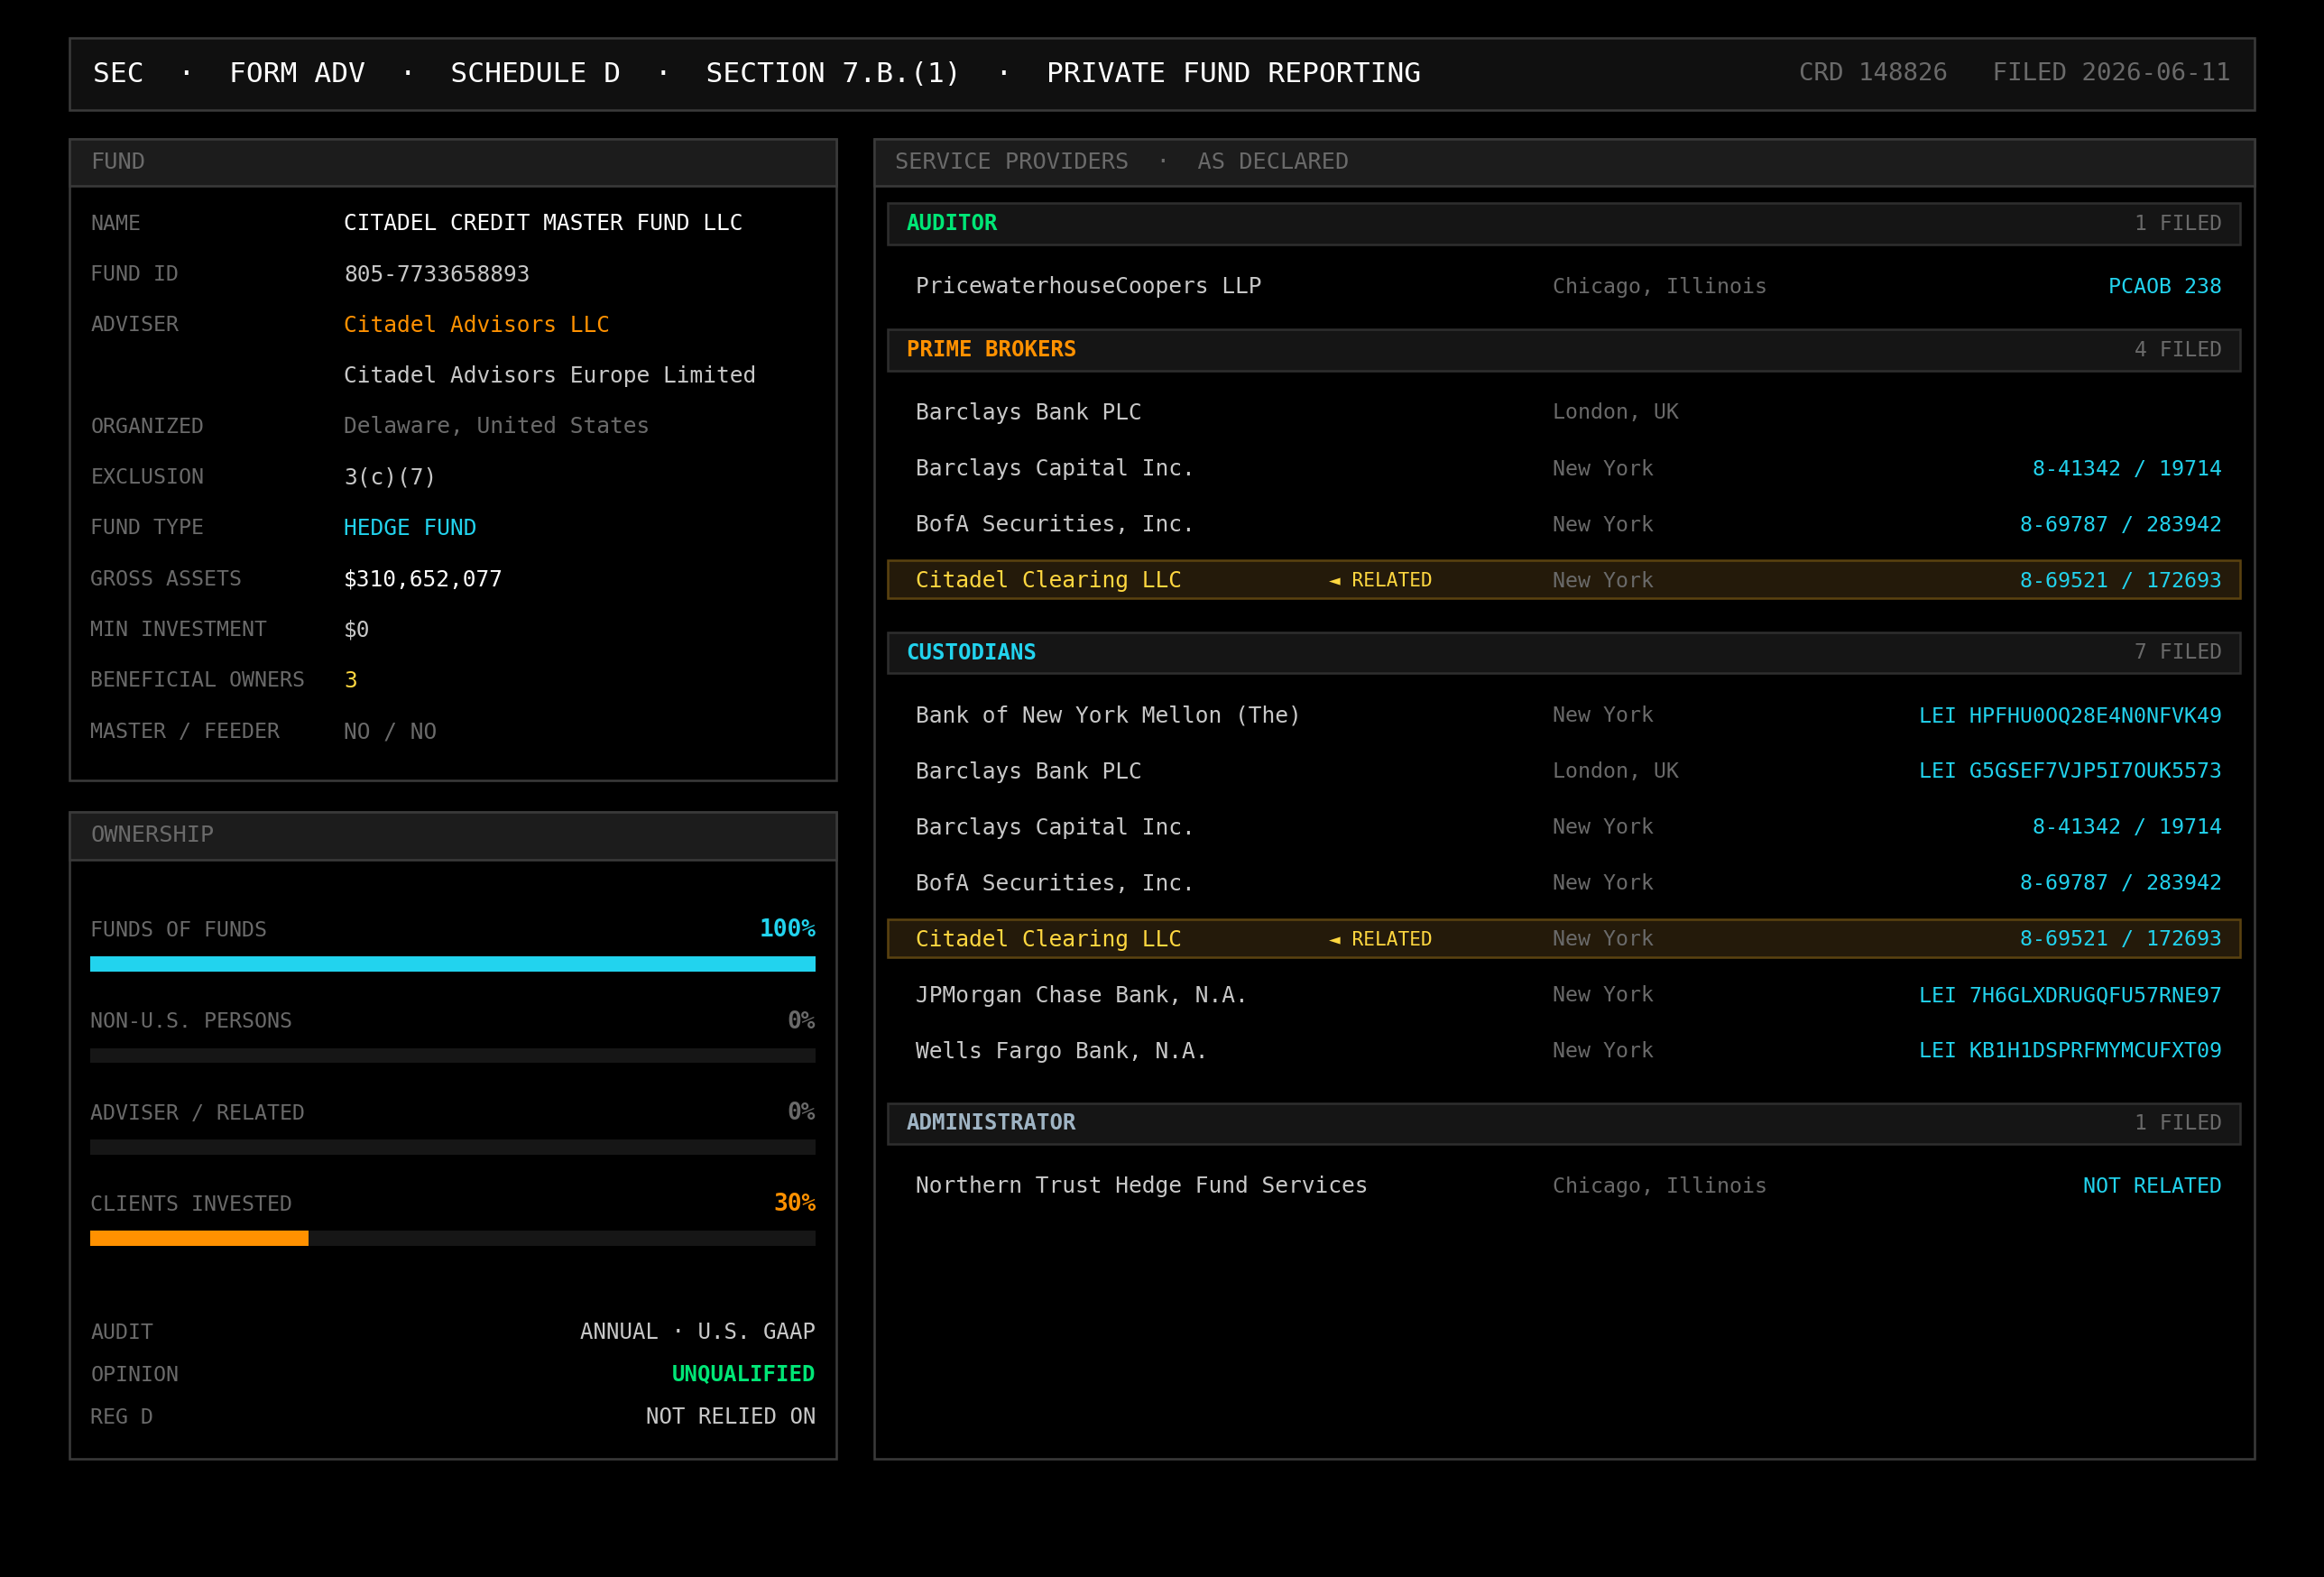
Every SEC-registered investment adviser, and every exempt reporting adviser, files Form ADV. Schedule D, Section 7.B.(1) breaks out each private fund the adviser runs: whether it is a hedge fund, its gross assets, its legal structure, who owns it, and, critically, its named service providers. The auditor. The prime brokers. The custodians. The administrator.
One fund's 7.B.(1): a 310 million USD Citadel credit vehicle, its four prime brokers, seven custodians and administrator, on the public record.
Read one filing and you have due diligence on one fund. Read the full filing set and you have a map: which funds clear through which dealers, who concentrates where, which administrator services half the industry. This is the dataset for understanding the plumbing, the same counterparty web that regulators worry about when they worry about hedge fund leverage.
It has a second, quieter use. Thousands of these funds have no website and no careers page, but their ADV lists their size, strategy and structure. If you are hunting for funds to apply to, the filing set is a better target list than any jobs board.
The latency is the price. Form ADV is filed annually, "within 90 days after the end of your fiscal year" per the instructions, so a fund's data can be nearly fifteen months old by the time you read it, and the fund updates mid-year only for certain material changes. This is a census, not a tape.
Look up any adviser at adviserinfo.sec.gov (the full ADV with every 7.B.(1) is under View Form ADV). Bulk monthly extracts of the filing set are on the SEC's Form ADV data page; note the monthly CSVs cover the main form items, while the complete Schedule D detail lives in the per-firm filings.
Latency Is the Whole Game
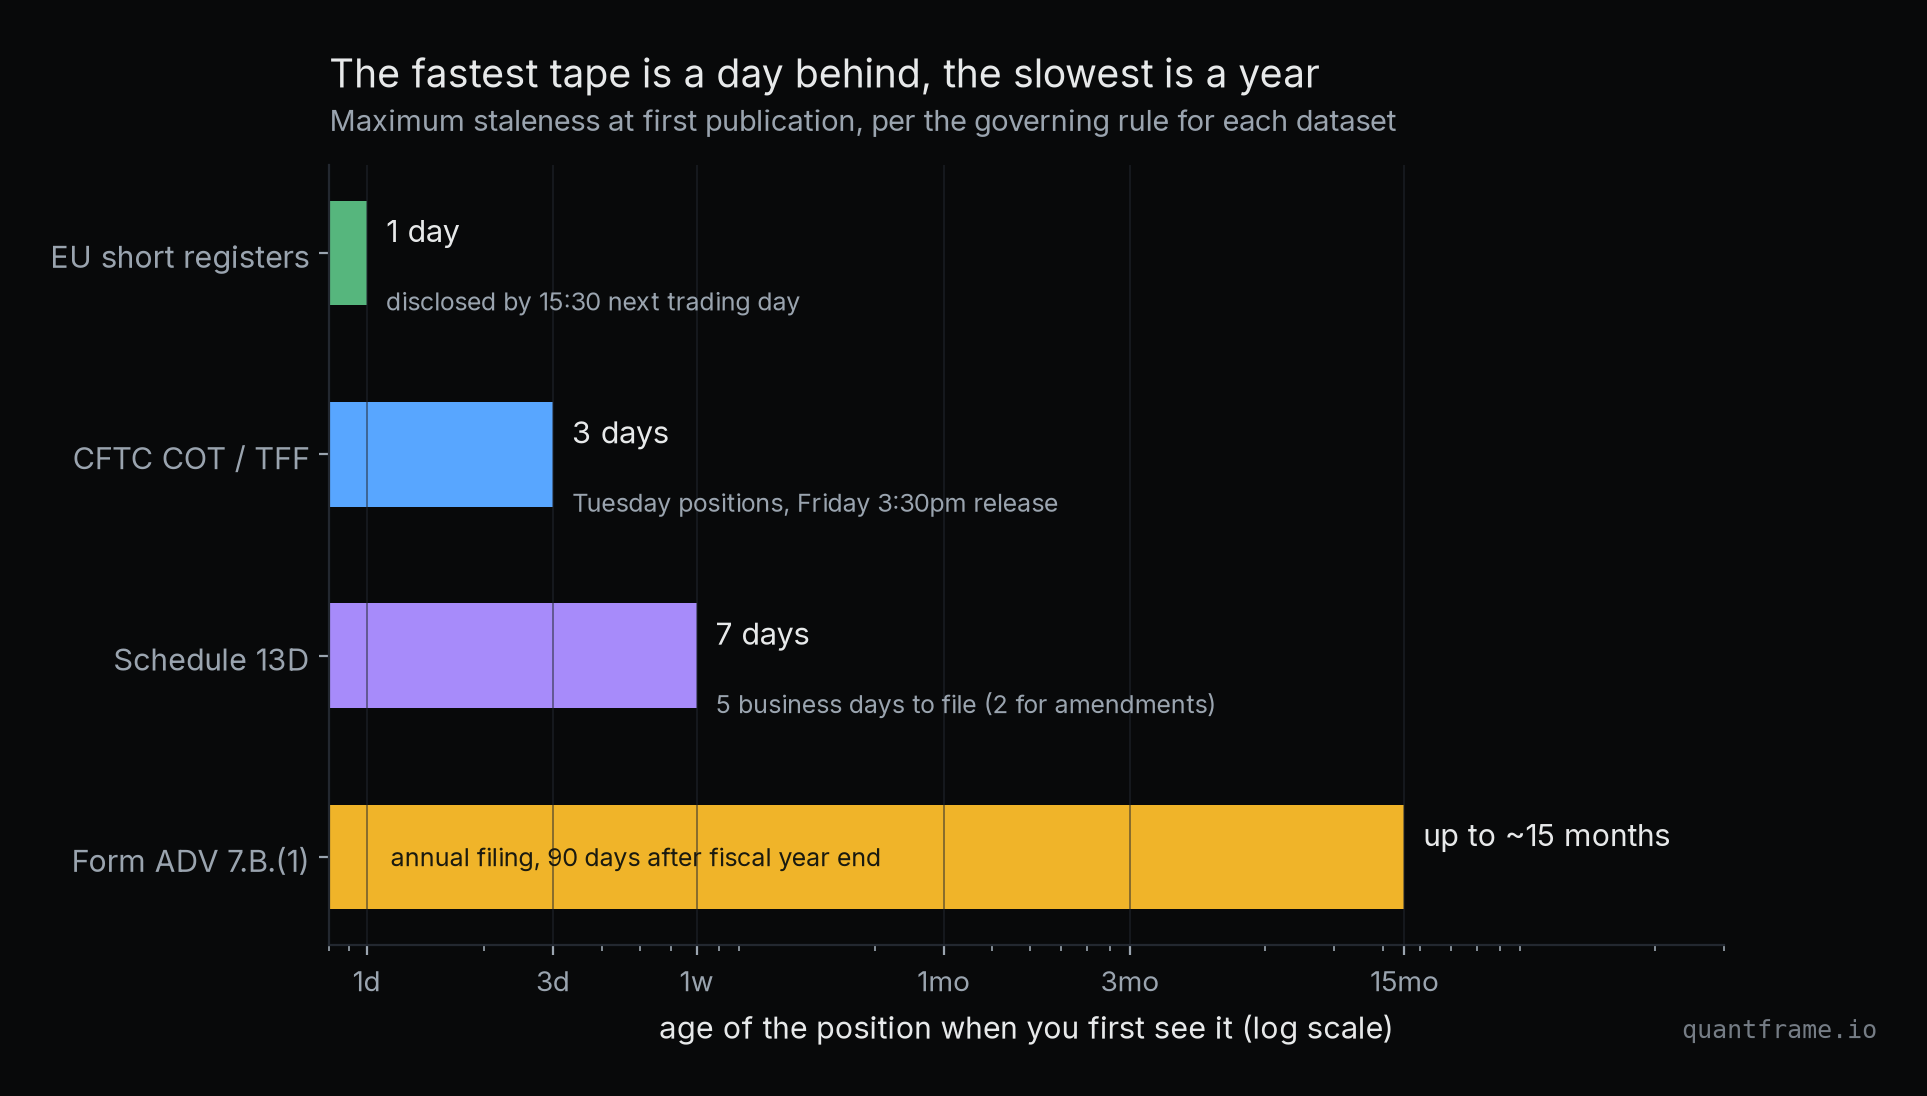
Put the four side by side and the structure of the paper trail becomes obvious: it is a spectrum from tape to census.
What "public" actually means, dataset by dataset. Pick the tool by how fresh your question needs the answer to be.
The EU registers are nearly live. COT is a weekly rhythm. 13D is event-driven with a one-week fuse. ADV is an annual portrait. None of them is tradeable signal on its own, and anyone selling you "follow the smart money" off a 13F, which is 45 days stale and longs-only, is selling you the slowest and blindest corner of this entire ecosystem.
What they are, together, is context that most retail participants never touch: which direction the leveraged money leans, who is short what by name, what the activists are actually demanding, and how the industry is wired underneath.
What This Means For You
1. Match the dataset to the clock. Squeeze-watching needs the one-day EU registers. Macro positioning needs the three-day COT. Event trades need EDGAR the hour the 13D drops. Career research and counterparty maps run fine on year-old ADV data. Using a slow dataset for a fast question is how people get hurt.
2. Follow funds, not snapshots. Every dataset here is a time series if you keep pulling it. One AFM row is trivia; 163 rows is WorldQuant's conviction, drawn as a chart. One 13D is news; thirteen amendments are a campaign log.
3. Read the definitions before the data. "Leveraged Funds" is a specific CFTC category, the 0.5 percent threshold hides everything beneath it, and cash-settled swaps walk straight past Schedule 13D. Every dataset's blind spot is written in its own rulebook, and the rulebook is always shorter than the losses from not reading it.
4. Aggregates for direction, names for stories. COT tells you what the herd of leveraged money is doing; the registers and filings tell you what a specific fund is doing. The first is a market indicator, the second is a case study. Confusing the two produces bad trades in both directions.
5. The best free data is regulatory exhaust. Nobody built these datasets for you, which is exactly why they are undervalued: no vendor markup, no survivorship filter, no marketing. Primary sources, straight from the regulator, at the cost of learning to parse a file.
Reading the data is the easy half; knowing what to compute on it is the actual skill. QuantFrame teaches the statistics, the Python and the market mechanics behind exactly this kind of work, with interactive problems and projects where you build it yourself. Your personalized roadmap is at quantframe.io.
End of entry
Found this useful?
Likes decide what gets written next.Sign in to like
QuantFrame
Liked this article?
QuantFrame teaches you the math, code, and projects to break into quant. Plus a personalized roadmap built for your background and goals.