Sharp upward equity curve, drawdowns that never exceed 15%, a Sharpe ratio above 2.0. You've tested it on five years of data. You've optimized the parameters. You're ready to trade real money.
Six months later, you're down 40% and questioning everything.
What happened? The same thing that happens to almost everyone who takes a backtest at face value: your backtest lied to you.
I don't mean the software had bugs. I mean something more insidious. The backtest told you exactly what you wanted to hear. It showed you a version of reality that cannot exist in live trading. And because you believed it, you sized up, you traded aggressively, and you got destroyed.
This isn't a failure of intelligence. Some of the smartest people I know have been fooled by backtests. The problem is that backtesting creates the illusion of scientific rigor while hiding a minefield of statistical traps.
Let me show you where the mines are buried.
Why Backtesting Is So Dangerous
Backtesting feels rigorous. You have data. You have rules. You run the simulation. Numbers come out. It feels like science.
But there's a fundamental asymmetry that makes backtesting treacherous: you're testing on the same data you used to develop the idea.
Think about what that means. You looked at historical data. You noticed patterns. You built rules to capture those patterns. Then you tested those rules on... the same data where you found the patterns.
Of course it works. You designed it to work on that data.
This is like memorizing the answers to a test and then being surprised you scored 100%. Yes, you got every question right. No, that doesn't mean you understand the material.
Real trading is the exam you haven't seen yet. And your backtest performance is almost always an upper bound on what you'll achieve live - often by a large margin.
The gap between backtested performance and live performance has a name in the industry: backtest overfitting. And it's the single biggest reason retail traders fail.
There are seven specific ways your backtest is lying to you right now. Professional quants call them the "seven deadly sins" - and I'm about to show you each one, how to detect them, and the validation techniques that separate real edge from statistical mirages...
The Seven Deadly Sins of Backtesting
Before we go deep, let me give you the map. There are seven primary ways backtests deceive you. Each one inflates your expected performance. Combined, they can turn a losing strategy into a backtest superstar.
1. Overfitting (Curve Fitting)
You've tuned your parameters so perfectly to historical data that they capture noise, not signal. The strategy is memorizing the past rather than learning from it.
2. Look-Ahead Bias
Your backtest uses information that wouldn't have been available at the time of the trade. This is surprisingly easy to introduce and devastatingly hard to detect.
3. Survivorship Bias
You're testing on data that only includes survivors. The stocks that went to zero, got delisted, or were acquired aren't in your dataset, and that absence skews everything.
4. Data Snooping (Multiple Testing)
You've tested hundreds of variations and picked the best one. Statistically, some variation was bound to look good by pure chance.
5. Unrealistic Execution
Your backtest assumes you can buy and sell at the prices you see. In reality, your orders move the market, slippage eats your edge, and you can't always get filled.
6. Selection Bias
You remember the backtests that worked and forget the ones that didn't. The strategy you're about to trade is the survivor of a process you've already forgotten.
7. Regime Blindness
You've tested on a period where your strategy's edge happened to exist. That regime may not persist. Your future may look nothing like your past.
Any one of these can destroy you. Most backtests suffer from several simultaneously.
Now here's what I want you to understand: knowing these biases exist isn't enough. Every trader has heard of overfitting. Most still do it. The difference between amateurs and professionals isn't knowledge of the problem - it's the ruthless discipline to avoid it.
Let me show you exactly how each bias works, how devastating it can be, and what professionals actually do to protect themselves.
Overfitting: The Silent Portfolio Killer
Overfitting is the most common and most destructive backtesting error. It's also the hardest to accept because an overfitted strategy looks amazing in testing.
Here's what happens. You start with a reasonable idea: "Maybe RSI works for mean reversion." You test it. Results are okay, but not great. So you start tweaking.
You try RSI period 14. Then 12. Then 10. You add a moving average filter. You try different lookback periods. You add a volatility condition. You try different thresholds. You test on different timeframes.
Each tweak improves the backtest. After 50 iterations, you have a strategy with 8 parameters that produces beautiful returns on your test data.
What you've actually done is fit your strategy to the noise in your specific dataset.
The signal in financial data is weak. The noise is strong. When you keep adjusting parameters until results improve, you're increasingly capturing the noise - the random fluctuations that won't repeat in the future.
There's a formula that captures this. The more parameters you optimize, the more "degrees of freedom" you're using. And there's a rough relationship:
If you optimize 10 parameters on 500 daily returns, that ratio is 0.02, and you can expect your live Sharpe to be roughly 15-20% lower than backtested. But if you optimize 10 parameters on only 100 trades (which is closer to reality for most strategies), that ratio is 0.1, and you should expect a 30-40% degradation - or complete failure.
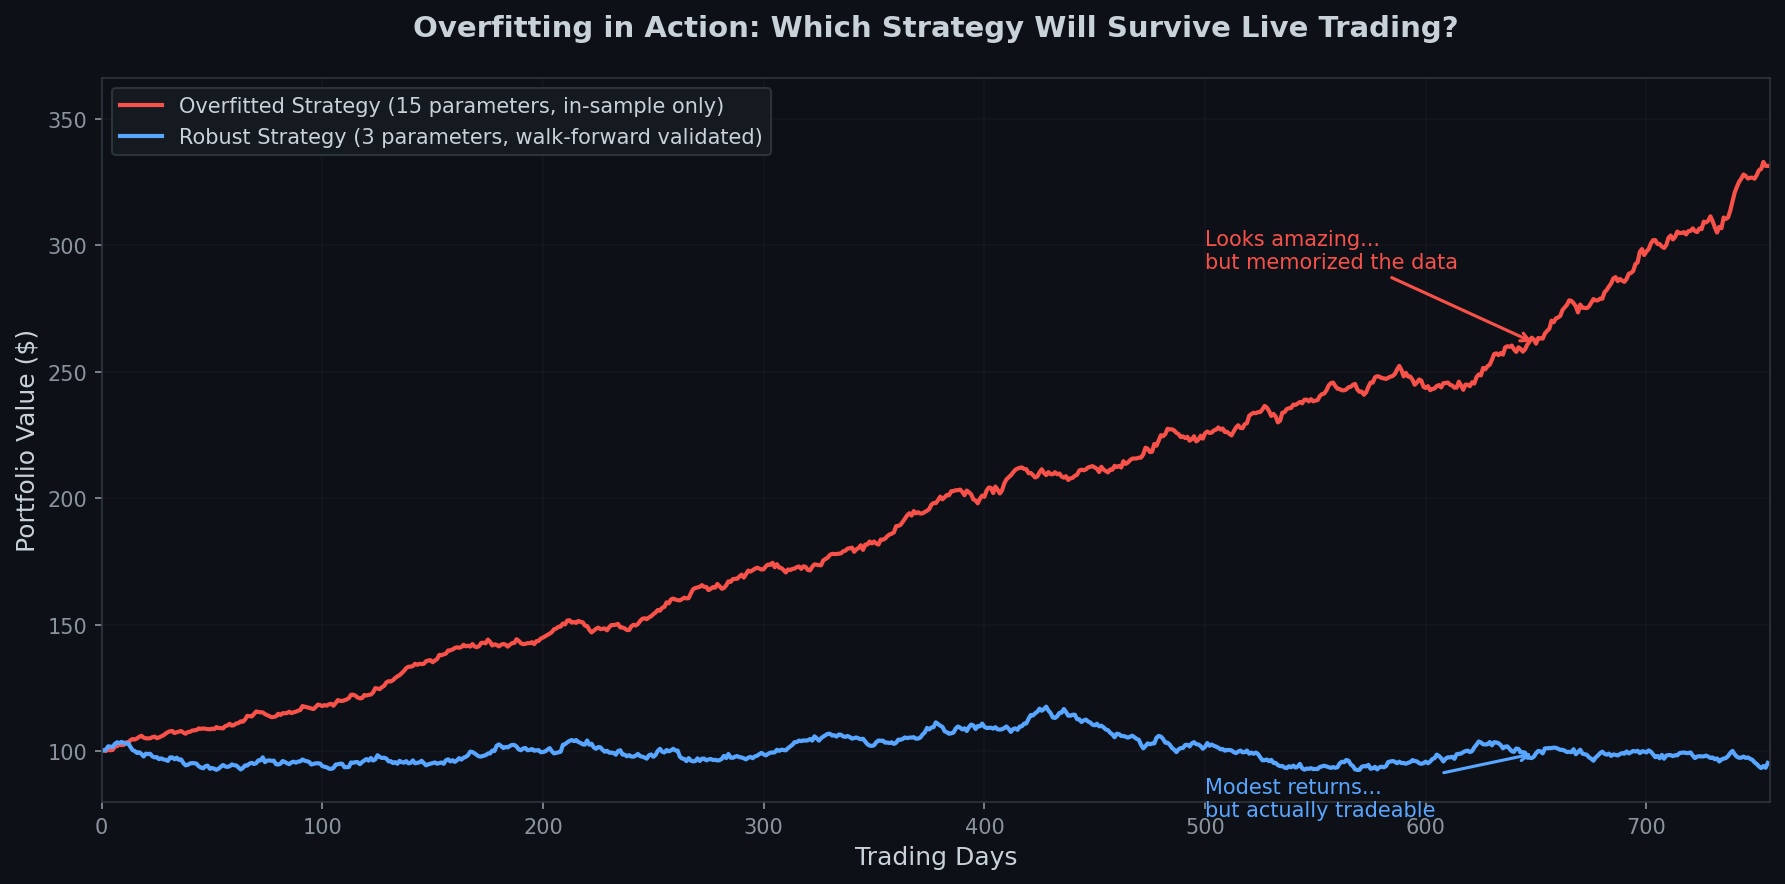
Here's what overfitting looks like visually. Imagine two equity curves:
Strategy A was developed with 2-3 parameters and tested out-of-sample. It shows steady but modest returns with realistic drawdowns.
Strategy B was developed with 15+ parameters, fully optimized on the test period. It shows explosive returns, minimal drawdowns, and a near-perfect equity curve.
Which one will perform better in live trading?
Strategy A. Every time.
Strategy B has memorized the past. Its parameters are tuned to capture every random wiggle in the historical data. When the future inevitably diverges from the past, it collapses.
An overfitted strategy looks incredible in backtests but collapses in live trading. The robust strategy shows modest, realistic returns.
The insider reality: Professional quant funds have strict rules about parameter count. A common rule of thumb: no more than 1 free parameter per 250-500 independent observations. Some firms require sign-off from a risk committee before adding any new parameter to a model. They understand that each parameter is a potential overfitting trap.
Meanwhile, retail traders routinely optimize 10+ parameters on a few hundred trades and wonder why their live results differ from their backtests.
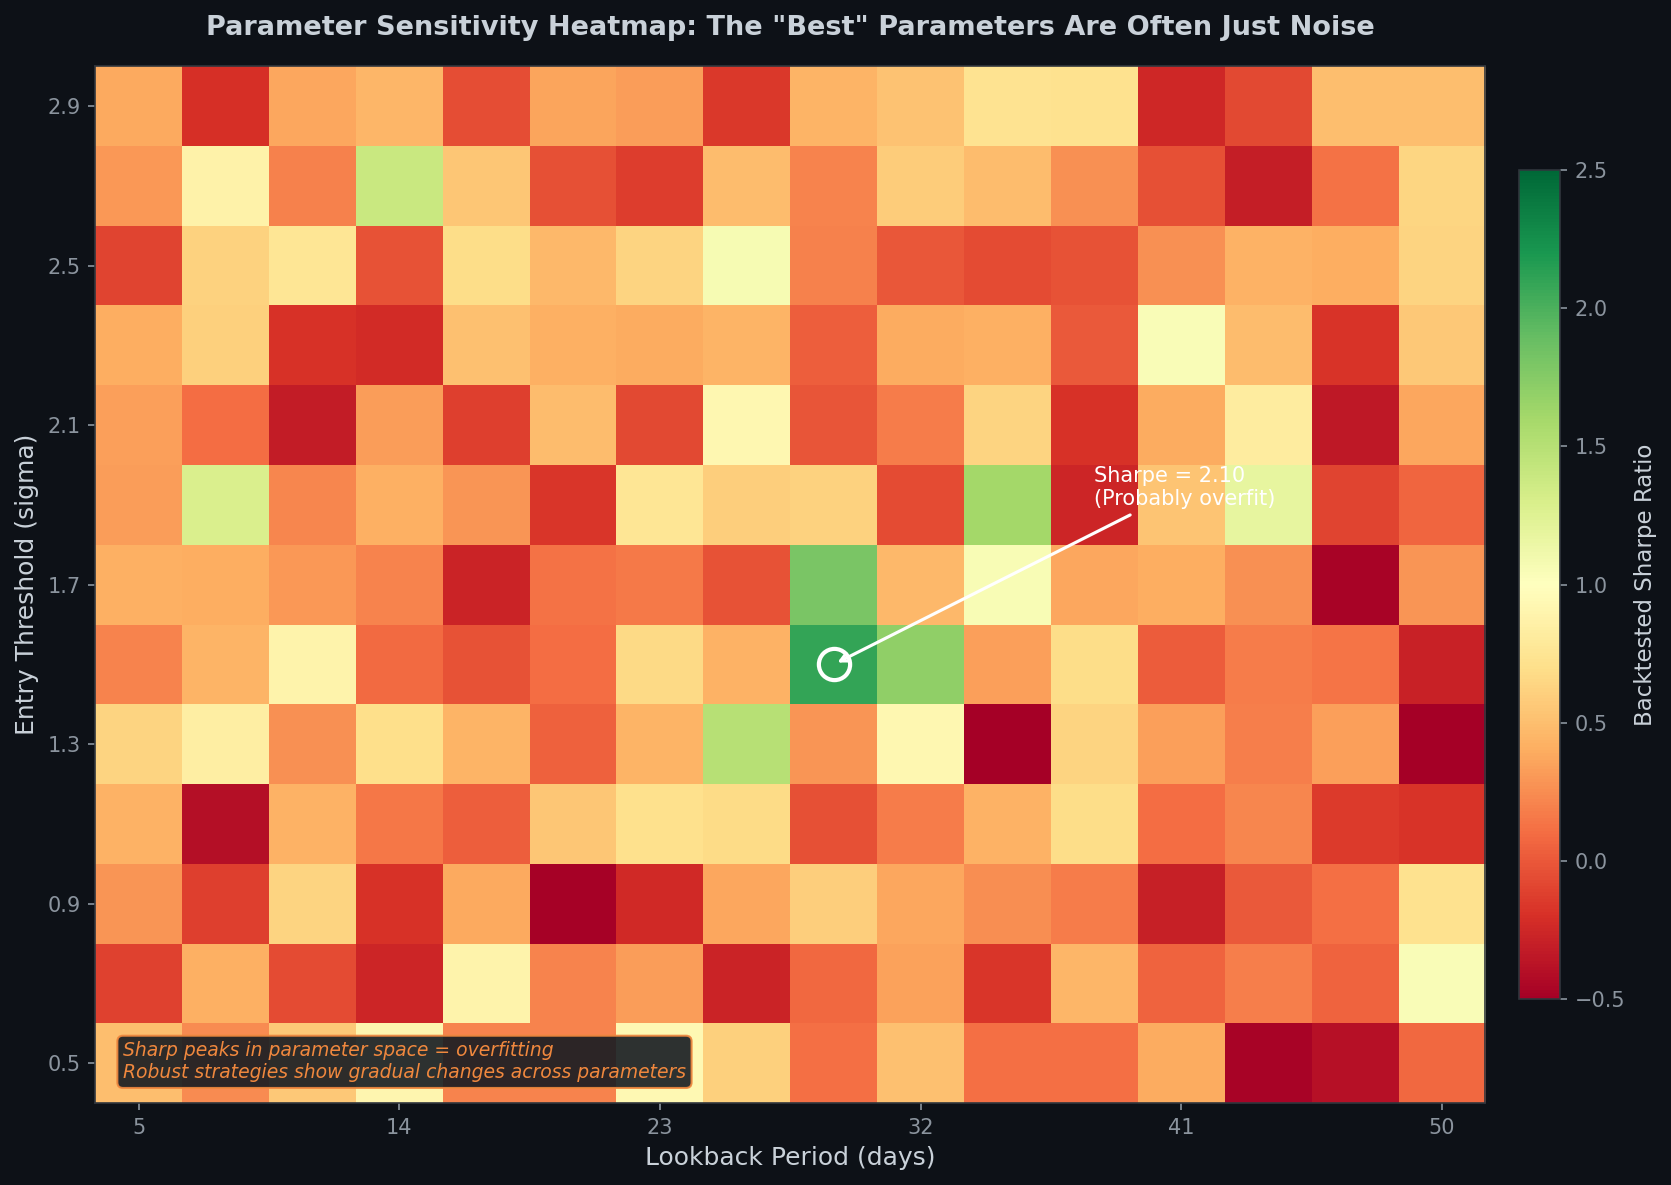
Sharp peaks in parameter space are a red flag. Robust strategies show gradual performance changes across parameters.
Look-Ahead Bias: The Time Traveler's Edge
Look-ahead bias occurs when your backtest uses information that wasn't available at the time of the simulated trade. It's one of the most insidious biases because it's easy to introduce and hard to detect.
Here's a simple example. You're testing a strategy that buys stocks when their quarterly earnings exceed analyst estimates. You pull "earnings surprise" data from a financial database and backtest.
The problem: that database contains the final, revised earnings figures. In reality, preliminary earnings are released first and often get revised weeks later. Your backtest used the final number. Your live trading will use the preliminary number. They're not the same.
Worse: analyst estimate data is frequently restated. The "consensus estimate" you see in historical data may have been updated after the fact to reflect estimates that came in late. Your backtest used a consensus that didn't exist in real-time.
This sounds minor. It's not. I've seen strategies with 200%+ annual returns in backtesting that were entirely driven by look-ahead bias. Once the bias was fixed, the edge disappeared completely.
Common sources of look-ahead bias:
Point-in-time data issues. Economic indicators get revised. GDP, unemployment, inflation - the first release is often quite different from the final figure. If your database contains final figures, you're looking ahead.
Index membership. If you backtest on "the S&P 500," which 500 stocks do you use? Today's constituents weren't in the index five years ago. Some of today's members were small caps then. Some of the 2019 members have been removed or acquired.
Adjusted prices. Stock prices are adjusted for splits and dividends. The adjusted close you see today for a date five years ago is different from what you would have seen at that time. This matters for position sizing calculations.
Technical indicators. Some indicators are inherently forward-looking in subtle ways. Pivot points, certain volatility measures, and anything that uses "high of the day" or "low of the day" can introduce bias if you're testing intraday.
The data itself existing. Some databases backfill data. A stock might be added to a database retroactively, giving you data from before it was actually available. If you're testing on "all stocks with complete data," you're selecting for survivors.
The fix: Point-in-time databases. Professional quants pay substantial money for databases that show you exactly what was known at each historical moment - no revisions, no backfilling. If you can't afford these, you need to be paranoid about every data source and assume look-ahead bias until proven otherwise.
Survivorship Bias: The Ghosts You're Not Seeing
Every dataset has ghosts - entities that used to exist but don't anymore. If your dataset only contains survivors, your backtest is lying.
The classic example is stocks. If you download S&P 500 data for the last 20 years, you get today's 500 members, each with complete price history. Seems reasonable.
But here's what you're missing:
Lehman Brothers. Was in the S&P 500 until September 2008, when it went to zero.
Enron. S&P 500 member until December 2001. Complete wipeout.
Bear Stearns. S&P 500 member until it was acquired in a fire sale in 2008.
Hundreds of others. Companies get acquired, go bankrupt, or get delisted for various reasons.
If your dataset doesn't include these casualties, your backtest is systematically biased toward success. You're only testing on companies that survived.
How bad is this? Worse than you think.
Studies have shown that survivorship bias alone can add 1-2% annually to backtested returns for equity strategies. That doesn't sound like much, but consider: if your strategy genuinely returns 8% annually and survivorship bias adds 1.5%, that's a 19% inflation in your expected returns. Your Sharpe ratio is similarly inflated.
This bias appears everywhere:
Mutual fund databases exclude funds that closed or merged (usually the bad ones)
Hedge fund databases suffer from both survivorship bias and backfill bias (funds only report data after they have a good track record)
Crypto datasets are full of coins that died - but most analysis only looks at coins still trading
Factor research tests on stocks still in existence, missing the ones destroyed by the very factors being studied
The insider reality: Professional factor researchers always use point-in-time databases that include delisted securities with their full history up until delisting. The difference in results between survivorship-free data and naive data is often the difference between a viable strategy and a worthless one.
The Hidden Transaction Cost Trap
Your backtest probably assumes execution at the prices you see. In reality:
You buy at the ask, sell at the bid (the spread)
Your order moves the price against you (market impact)
You can't always get filled at all (liquidity)
Large orders take time to execute (slippage during execution)
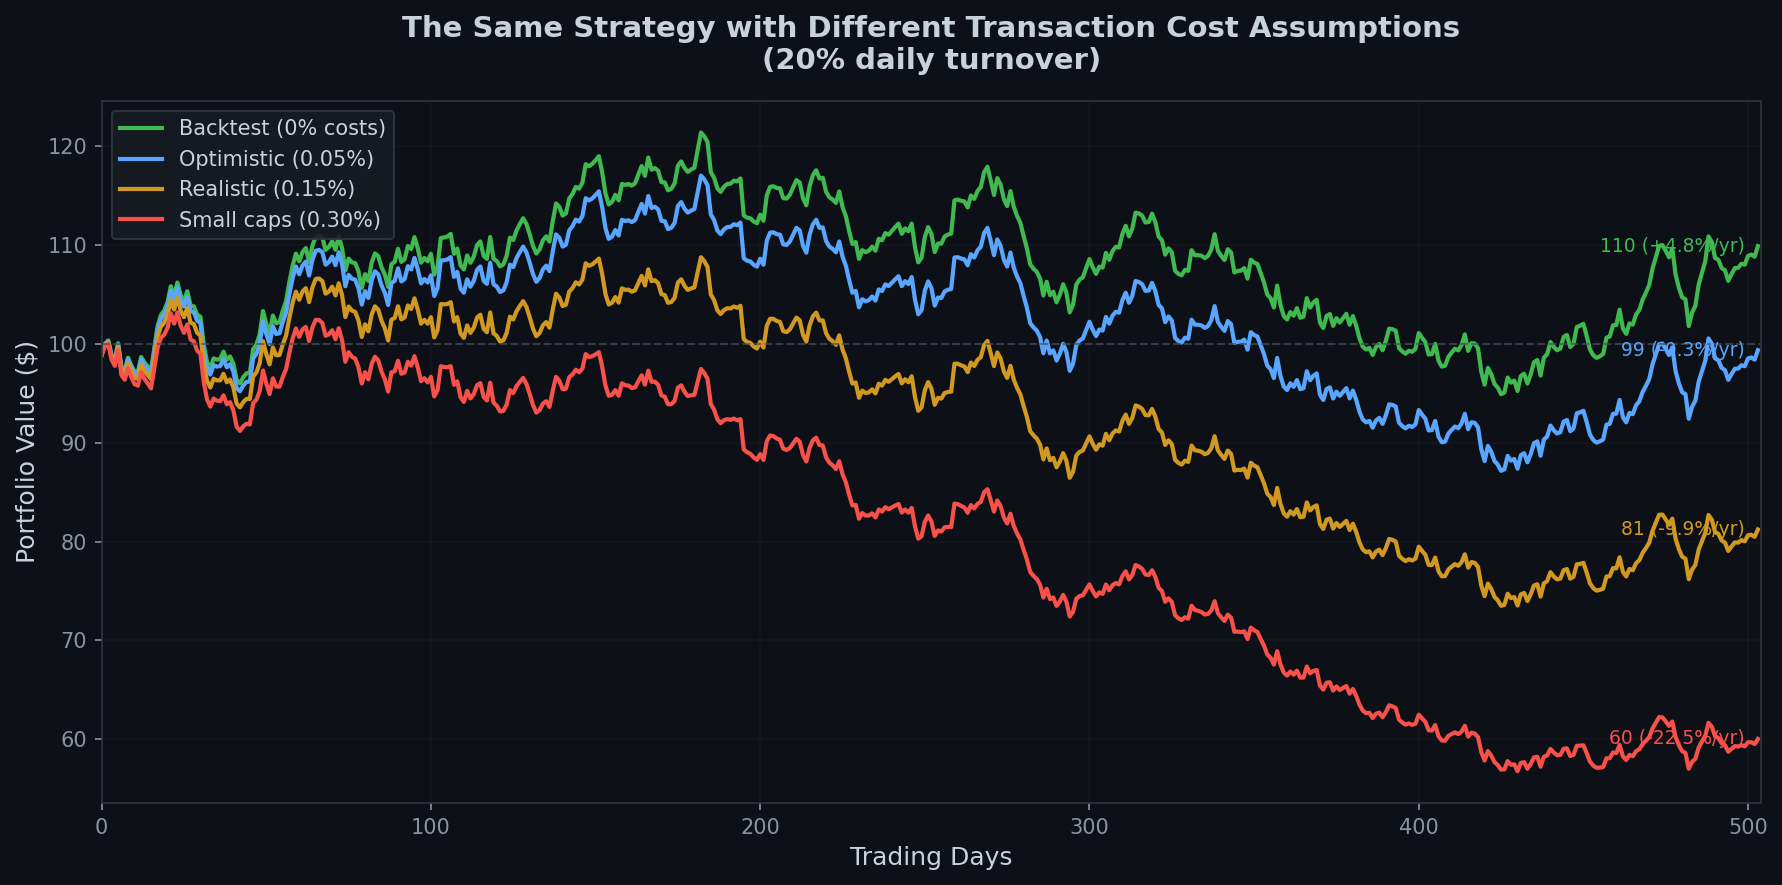
For strategies with high turnover, these costs aren't noise - they're often larger than the entire expected profit.
Let me quantify this. Say you're running a momentum strategy with monthly rebalancing. You turn over 100% of the portfolio per month (completely replace it). On a 1 million dollar portfolio, that's 1 million dollars in buys and 1 million dollars in sells.
If your average spread plus impact is 0.10% (very optimistic for small caps, conservative for large caps), you're paying:
Monthly Cost=2×$1,000,000×0.001=$2,000
That's $24,000 per year, or 2.4% of your capital - just in transaction costs. Many momentum strategies show 5-7% annual edge in frictionless backtests. After realistic costs, half that edge is gone.
Now consider a higher-frequency strategy, say one that trades daily with 50% daily turnover. Same math:
Annual Cost=252×2×$500,000×0.001=$252,000
That's 25.2% of your capital, gone to friction. Your strategy needs to generate 25%+ just to break even.
Market impact is worse than you think. The 0.10% I used above is optimistic. For less liquid securities, or for larger orders, market impact can be 0.5-2% per side. I've seen backtests showing 50% annual returns that were entirely eliminated by realistic transaction cost modeling.
The formula for estimating market impact (the "square root rule") is:
Impact≈σ⋅VdailyVtrade
Where σ is daily volatility, Vtrade is your order size, and Vdaily is average daily volume. For a stock with 2% daily volatility, if you're trading 1% of daily volume, that's 0.02×0.01=0.2% expected impact - per side.
The same 15% annual edge strategy becomes a loser once realistic transaction costs are applied.
How Professional Quants Actually Validate Strategies
Now for the part that matters: what do you do about all this?
Professionals don't just backtest. They validate. And validation is a fundamentally different process.
Walk-Forward Analysis
The single most important validation technique is walk-forward analysis. Here's how it works:
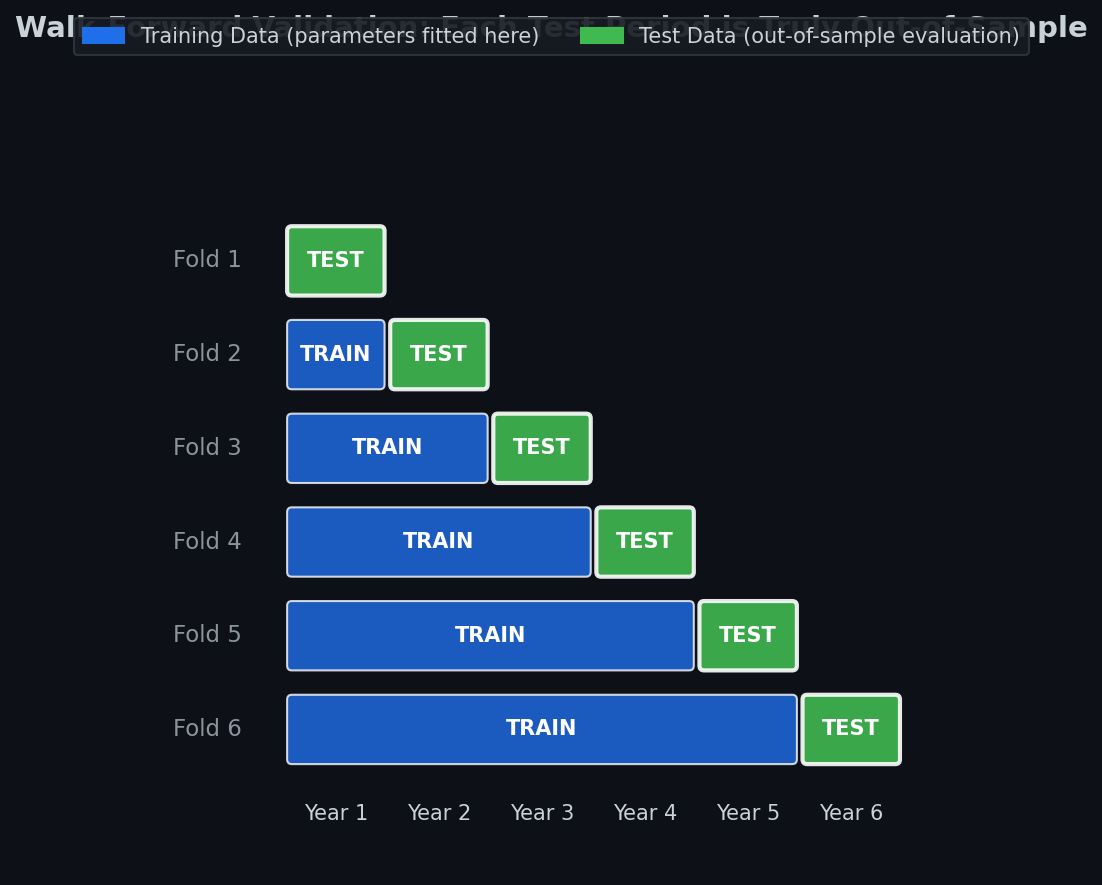
Split your data into segments. Say you have 10 years of data. Split it into 10 one-year periods.
For each period, train on everything before it. To test year 5, you train on years 1-4.
Test only on the forward period. Year 5 is pure out-of-sample.
Combine all out-of-sample periods. Your "true" backtest is the concatenation of all these out-of-sample tests.
In walk-forward validation, each test period only uses data that was available at the time - no peeking ahead.
This is fundamentally different from a standard backtest. In a standard backtest, you've seen all the data before you finalize your strategy. In walk-forward, each test period is genuinely unseen when you generate predictions for it.
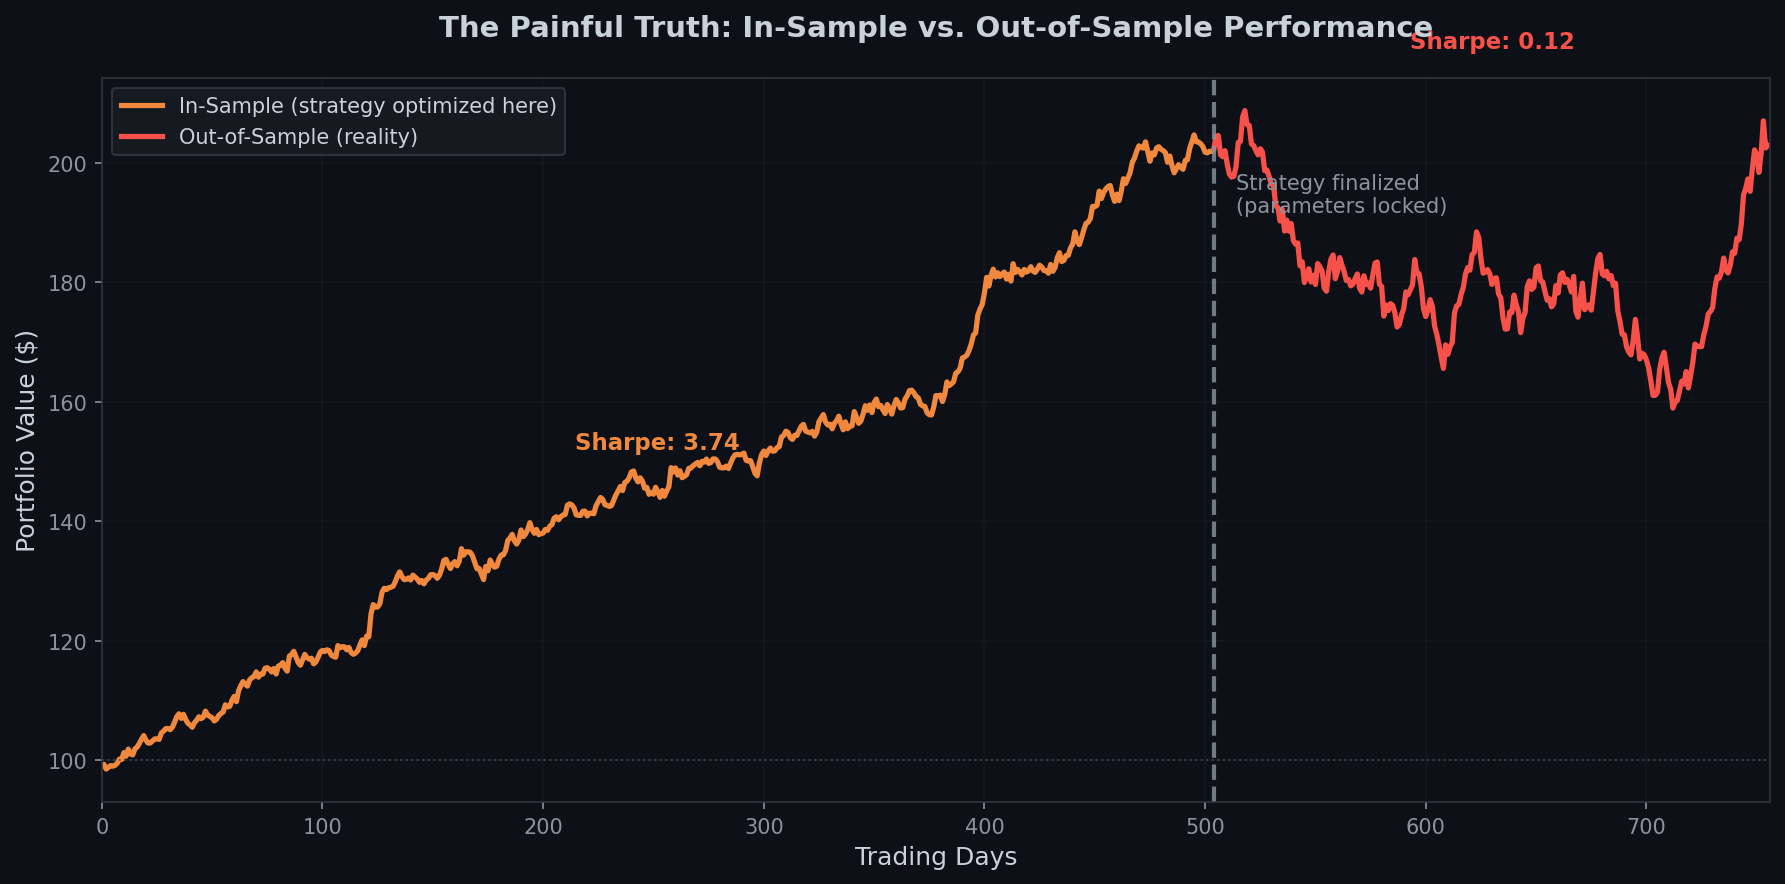
The results are humbling. Strategies that show 40% annual returns in standard backtesting often show 10-15% in walk-forward - or negative returns. That difference is the sound of overfitting being revealed.
The painful truth: a Sharpe of 2.8 in-sample became -0.4 out-of-sample. This is what overfitting looks like.
The Deflated Sharpe Ratio
When you test many strategy variations, some will look good by chance. The "Deflated Sharpe Ratio" penalizes for this multiple testing.
Developed by Marcos Lopez de Prado, it answers: "Given how many strategies I tested to find this one, what's the probability its performance is due to luck?"
The core insight is that the more strategies you test, the higher the bar should be for statistical significance:
SRrequired≈V⋅Φ−1(1−N1)
Where V is variance (of returns), N is the number of strategies tested, and Φ−1 is the inverse normal CDF.
If you've tested 100 strategies, you'd expect the best one to have a Sharpe of roughly 0.6-0.8 by pure chance. That "edge" is entirely noise. Your strategy needs to substantially exceed this threshold to claim genuine significance.
Practical rule of thumb: If you've tested 100+ parameter combinations, don't trust anything below a Sharpe of 1.5 in backtesting. Below that threshold, you cannot distinguish signal from noise.
Monte Carlo Permutation Tests
Another powerful technique: scramble your data and see if your strategy still works.
The logic is elegant. If your strategy captures real market structure, it shouldn't work on randomized data. If it works just as well on shuffled returns, you've overfit to noise.
The process:
Run your strategy on real data. Record the Sharpe ratio.
Randomly shuffle the returns (destroying any time-series structure).
Run your strategy on shuffled data. Record the Sharpe ratio.
Repeat steps 2-3 a thousand times.
Compare your real Sharpe to the distribution of shuffled Sharpes.
If your real Sharpe is in the top 5% of the shuffled distribution, you have evidence (not proof) of a real edge. If it's in the middle of the pack, your strategy is indistinguishable from random.
Before trading any backtested strategy with real money, work through this checklist:
Data Quality
[ ] Is your data from a reputable source with known methodology?
[ ] Does it include delisted/acquired/bankrupt entities?
[ ] Is it point-in-time (no retroactive adjustments)?
[ ] Have you verified it against an independent source?
Overfitting Prevention
[ ] Is your parameter count justified by your sample size?
[ ] Have you tested out-of-sample (data you never touched during development)?
[ ] Have you done walk-forward validation?
[ ] Would a simpler version of the strategy also work?
Look-Ahead Bias
[ ] Does every data point only use information available at that moment?
[ ] Are index memberships point-in-time?
[ ] Are economic indicators the initial release, not revised?
Execution Reality
[ ] Have you modeled spreads realistically?
[ ] Have you modeled market impact for your expected order sizes?
[ ] Have you tested with different execution assumptions?
[ ] Is the strategy still profitable with 2x your expected costs?
Statistical Validity
[ ] Is your track record long enough to be meaningful?
[ ] Have you adjusted for the number of strategies tested?
[ ] Is the Sharpe ratio high enough to survive the deflation adjustment?
[ ] Does the strategy pass permutation tests?
Regime Robustness
[ ] Have you tested across different market regimes?
[ ] Does it work in both bull and bear markets?
[ ] Does it work in both high and low volatility?
[ ] Are there obvious regimes where it would fail?
If you can't check most of these boxes, you're not ready to trade live.
Recommended Tools for Real Validation
If you're serious about backtesting properly, here are tools used in the industry:
For Research & Backtesting:
Zipline (Python): Open-source, used internally at Quantopian. Good for equity strategies.
QuantConnect: Cloud-based, supports multiple asset classes, has point-in-time equity data.
Quantlib (C++/Python): Derivatives pricing and risk management.
For Execution Modeling:
Know that most public backtesting tools have primitive or no execution cost modeling. Professional shops build custom models.
For Data:
Sharadar (now part of Nasdaq): Point-in-time fundamentals, reasonably priced.
CRSP: Academic-standard US equity data, includes delistings.
Compustat: Fundamentals, widely used in factor research.
For retail traders: assume you don't have good data. Be paranoid.
The Honest Truth
I want to leave you with an uncomfortable reality.
Most backtests are worthless. Not misleading - worthless. The number of statistical traps, data quality issues, and psychological biases is so high that the default assumption should be that any backtest is lying to you.
The difference between retail traders and professional quants isn't intelligence. It's paranoia. Professionals assume their backtests are wrong until proven otherwise. They spend more time trying to break their strategies than trying to validate them. They're actively looking for reasons the backtest is lying.
Retail traders do the opposite. They want confirmation. They see a good backtest and feel validated. They skip the hard work of validation because the backtest already told them what they wanted to hear.
The next time you run a backtest and see those beautiful returns, don't celebrate. Ask: "How is this lying to me?" Find the lie before the market does.
Because the market will find it. The market always finds it.
Building robust backtesting skills? Follow along on Instagram @mirkovicdev for more quant insights.
End of entry
Found this useful?
Likes decide what gets written next.Sign in to like
QuantFrame
Liked this article?
QuantFrame teaches you the math, code, and projects to break into quant. Plus a personalized roadmap built for your background and goals.